Search Results for: High Interest Savings

Treasury Bond vs. Bank CD Rates: Adjusting For State and Local Income Taxes

If you are an individual investor that usually buys bank certificates of deposit, right now you may want to compare against a US Treasury bond of similar maturity. Treasury bond rates are traded constantly, but this Vanguard brokered CD page can provide a rough idea if they are worth a closer look (even though their brokered CD may or may not be the best CD rate available). Again, this screenshot is already out of date:

Right now, they are pretty close for many maturity lengths. For example, let’s take a 1-year CD paying 3% APY and a 1-year Treasury bond paying 3%.

(Note: This may not be true by the time you read this. Here are the current Treasury bond rates. In the last two weeks alone, the 1-year Treasury has ranged from 2.79 to 3.21%. In 2022 alone, the low was 0.38%.)

An important consideration is that Treasury bonds are exempt from state and local taxes. This can make the Treasury bond significantly more attractive to some folks, even if the initial rate is the same. This assumes you are investing in a taxable account (not tax-sheltered). US Savings bonds are also exempt from state and local taxes.

For example, let’s say you are a single resident of California with a taxable income of $80,000 annually. Any easy way to compare the rates is by using a calculator like this Fidelity tax-equivalent yield calculator. Using the example income, it will find that your marginal tax rates are 22% Federal and 9.30% State (CA). I am assuming no local tax rates from your city or county.

What matters in the end is what you are left with after taxes. As such, the calculator supplies the following chart:

For this example person, a Treasury bond earning 3% will pay the same after-tax interest as a bank certificate of deposit paying 3.44%.

Here is a rough check on my part:

$10,000 * 3.44% * (1 – 0.22 – 0.093) = $236 in annual interest, after taxes

$10,000 * 3.00% * (1 – 0.22) = $234 in annual interest, after taxes

I suspect the minor difference has to do with the way that bond yields are quoted for Treasury bonds. This is also why the corporate bond yields are different from the CD yields even though they are subject to the same taxes.

Bond yields, except CDs, are assumed to be twice the semi-annual yield, as is the normal convention for quoting bond yields. CD yield is calculated as ((( corporate bond yield / 2) +1)² ) – 1

From the calculator fine print:

The calculator does not take into account:

– Reductions and limits on federal itemized deductions
– State and local taxes are not deducted from your federal tax rate. Depending on your personal situation, this may cause the resulting yield to be overstated.
– Federal alternative minimum tax (AMT)
– State alternative minimum tax
– Intangibles taxes levied by individual states
– Net Investment Income Tax
– Additional Medicare Tax

For practical purposes, I don’t sweat the minor differences. In order to actually buy many of these Treasury bonds at the time that you want and for the remaining maturity length that you want, you’ll have to buy them on the open secondary market. The available rates will change by the minute. Or, if you buy them as a new issue, you won’t know the rate at all as it is determined at auction. I mostly just want to know that the Treasury bond is preferable to a bank CD by an adequate margin. In this example, I would say that 0.44% higher annually is enough of a margin.

There are other wrinkles… if you don’t hold to maturity, Treasury bonds don’t offer the ability to withdraw early and only pay a preset interest penalty like a bank CD. You’d have to sell again on the open market, where you may lose (or gain) principal.

Armed with this information, you might create your own bond ladder using US Treasuries instead of a CD ladder. This is easy for an individual investor because you don’t need any skill to determine creditworthiness. Both US Treasury bonds and FDIC/NCUA-insured certificates of deposit are backed by the full faith and credit of the US government. (Municipal bonds don’t come with such a guarantee. Some municipalities are in better financial shape than others. I don’t buy individual municipal bonds for this reason.)

MMB Humble Portfolio 2022 2nd Quarter Update: Asset Allocation & Performance

portpie_blank200Here’s my quarterly update on my current investment holdings as of 7/8/22, including our 401k/403b/IRAs and taxable brokerage accounts but excluding real estate and side portfolio of self-directed investments. Following the concept of skin in the game, the following is not a recommendation, but just to share an real, imperfect, low-cost, diversified DIY portfolio. The goal of this “Humble Portfolio” is to create sustainable income that keeps up with inflation to cover our household expenses.

“Never ask anyone for their opinion, forecast, or recommendation. Just ask them what they have in their portfolio.” – Nassim Taleb

TL;DR changes: Went from 67/33 stocks/bonds ratio to 64/36, so buying more US and International Stocks with available cashflow.

How I Track My Portfolio
I’m often asked how I track my portfolio across multiple brokers and account types. (Morningstar also recently discontinued free access to their portfolio tracker.) I use both Personal Capital and a custom Google Spreadsheet to track my investment holdings:

  • The Personal Capital financial tracking app (free, my review) automatically logs into my different accounts, adds up my various balances, tracks my performance, and calculates my overall asset allocation daily.
  • Once a quarter, I also update my manual Google Spreadsheet (free, instructions) because it helps me calculate how much I need in each asset class to rebalance back towards my target asset allocation. I also create a new tab each quarter, so I have snapshot of my holdings dating back many years.

July 2022 Asset Allocation and YTD Performance
Here are updated performance and asset allocation charts, per the “Allocation” and “Holdings” tabs of my Personal Capital account.

Target Asset Allocation. I call this my “Humble Portfolio” because it accepts the repeated findings that individuals cannot reliably time the market, and that persistence in above-average stock-picking and/or sector-picking is exceedingly rare. Costs matter and nearly everyone who sells outperformance, for some reason keeps charging even if they provide zero outperformance! By paying minimal costs including management fees and tax drag, you can actually guarantee yourself above-average net performance over time.

I own broad, low-cost exposure to productive assets that will provide long-term returns above inflation, distribute income via dividends and interest, and finally offer some historical tendencies to balance each other out. I have faith in the long-term benefit of owning publicly-traded US and international shares of businesses, as well as the stability of high-quality US Treasury and municipal debt. My stock holdings roughly follow the total world market cap breakdown at roughly 60% US and 40% ex-US. I add some “spice” to the vanilla funds with the inclusion of “small value” ETFs for US, Developed International, and Emerging Markets stocks as well as additional real estate exposure through US REITs.

I strongly believe in the importance of knowing WHY you own something. Every asset class will eventually have a low period, and you must have strong faith during these periods to truly make your money. You have to keep owning and buying more stocks through the stock market crashes. You have to maintain and even buy more rental properties during a housing crunch, etc. A good sign is that if prices drop, you’ll want to buy more of that asset instead of less. I don’t have strong faith in the long-term results of commodities, gold, or bitcoin – so I don’t own them.

I do not spend a lot of time backtesting various model portfolios, as I don’t think picking through the details of the recent past will necessarily create superior future returns. Usually, whatever model portfolio is popular in the moment just happens to hold the asset class that has been the hottest recently as well.

Find productive assets that you believe in and understand, and just keep buying them through the ups and downs. Mine may be different than yours.

I have settled into a long-term target ratio of roughly 70% stocks and 30% bonds (or 2:1 ratio) within our investment strategy of buy, hold, and occasionally rebalance. This is more conservative than most people my age, but I am settling into a more “perpetual income portfolio” as opposed to the more common “build up a big stash and hope it lasts until I die” portfolio. My target withdrawal rate is 3% or less. Here is a round-number breakdown of my target portfolio.

  • 30% US Total Market
  • 5% US Small-Cap Value
  • 20% International Total Market
  • 5% International Small-Cap Value
  • 10% US Real Estate (REIT)
  • 20% High-Quality bonds, Municipal, US Treasury or FDIC-insured deposits
  • 10% US Treasury Inflation-Protected Bonds (or I Savings Bonds)

Commentary. According to Personal Capital, my portfolio down about 16% for 2022 YTD. My US and International stocks have dropped enough that all new cashflow is being placed into buying more of those asset classes. Simple as that. Keep on truckin’.

Since that was so short and boring, here a quick fact that I keep in my head. Using the “Rule of 72”, we know that if your portfolio returns 7% a year, it will double roughly every 10 years. $10,000 invested for 10 years will double to $20,000. However, $10,000 invested for 20 years will quadruple into $40,000. $10,000 invested for 30 years will octuple into $80,000. That provides a sense of the power of compounding and how it starts slow but kicks into turbo mode later on. I’ve been investing for about 20 years, so I’m getting to the good part! 😉

I’ll share about more about the income aspect in a separate post.

Enzo Fintech App: 2% Cash Back on Rent (Up to $150/Year), Special APY and Equity For Early Members

Updated July 2022. Enzo is another fintech app with the catchy feature of 2% cash back on rent, but unfortunately the earning caps are much more modest than initially promised. They are also dangling the possibility of higher interest rates and owning shares in the actual company to the first 25,000 members.

Cashback on spending. From their disclosures (emphasis mine):

Eligible accounts that meet the minimum requirements can earn 10% cashback on Uber, 5% on DoorDash, 2% on rent or mortgage payments, and 1% on everything else, limited to $20 per calendar month and $150 per calendar year. Once the monthly and/or annual limits have been reached, you will continue to earn 0.25% on all of your card spend. The maximum total cashback you can earn in a calendar year is $2,500.

Cashback on rent or mortgage payments is limited to one transaction per month. Enzo reserves the right to request additional documentation providing proof that the payments are bona fide rent or mortgage payments if it suspects unusual activity. Terms are subject to change. Cashback will be credited to your account the following month for qualifying transactions made the previous month.

If you only put rent on your debit Visa card, then you would max out the $20 monthly limit at a monthly rent of $1,000. However, you would max out the annual $150 cash back limit at a monthly rent of $625. Both are below the US average rent of $1,100 a month for a 1 bedroom apartment. Is what works out to $12.50 a month ($150/12) worth it?

Checking account APY on savings. 1.49% APY as of 6/16/2022. This is above average for most online savings accounts. Banking services provided by Blue Ridge Bank N.A.; Member FDIC.

In a strange move, they have already announced that they “plan to raise the interest rate on the Enzo Checking Account to 2.15% effective August 1st, 2022.” As a fine print reader, I know that “plan” leaves them an out. It’s just a “maybe”. Why not just increase it now?

They also “plan” to raise it to 3.10% APY for the first 25,000 Enzo customers. As of 7/4/22, there are at 6,090 members. Track the numbers here.

As a reward for your support, once we reach 25,000 Enzo Customers, we plan to reward all our Founding Members by raising the interest rate to 3.10% on the Enzo Checking Account.

Investing. Very few details on this so far, beyond “$0 fee trading” which nearly every other broker already offers.

Equity in the company? Here’s what they say:

Enzo is committed to helping you create wealth over time. That’s why we are granting equity to our early members and reserving a piece of the company to permanently be owned by you.

From the disclosures:

All Enzo Waitlist members will be eligible to receive Enzo equity, and can earn additional equity by referring friends.

And curiously:

Equity is subject to terms and conditions and does not require opening an Enzo account. Terms for receiving equity available upon request.

After multiple “request” e-mails, I received a little more info at this link:

To receive Enzo stock you must be registered on the Enzo waitlist. You’ll be issued one share of Enzo stock initially. You’ll get one additional share of Enzo stock for every three referrals that sign up for the Enzo waitlist. You can earn a maximum of 250 Enzo shares for qualified referrals.

Total shares under the Waitlist Equity Program (“WEP”) shall not exceed 100,000. WEP is subject to terms and conditions and does not require opening an Enzo account. Enzo reserves the right to modify the program at any time. Terms for receiving equity will be available soon upon request.

Honestly, the likelihood of this equity actually paying out is very low, but you never know. I am old enough to have gotten free TravelZoo shares that actually materialized during the dot-com boom.

I couldn’t find much media coverage about Enzo. In November 2021, this article announced a seed round with a modest $3 million in funding.

Shrug. I still signed up on the waitlist with my e-mail since it is free with no commitment (that is my link). This is a very young startup and we’ll see if it can pull it off.

Why I Emptied Out My Crypto Exchange Accounts (Including Stablecoins)

via GIPHY

As I’ve said many times, I’m not a crypto expert. However, I do enjoy financial history. As such, I’ve followed crypto through the lens of Matt Levine’s observation that “most of what actually happens with Bitcoin is about rediscovering financial history and re-creating the traditional financial system from scratch.”

FDIC insurance didn’t come around until 1933, after the collapse of many banks during the Great Depression. With FDIC insurance, every bank is essentially equally safe if you remain under the balance limits. Before FDIC insurance, you had to choose very carefully where you kept your money because if the bank failed, then your cash disappeared as well. So when there was any whisper of bank failure, you would have everyone rushing to withdraw, thus causing a “run on the bank”. Warren Buffett had an timely quote in the 2022 Berkshire Hathaway annual meeting:

If you ever buy a bank, and there are two banks in town, hire a few extras, and have them go over and start standing in line at the other guy’s bank. (Laughter)

And there’s only one problem with that. After a while, somebody will stand in front of your bank, you know, and then both of you are gone.

Let’s look at recent events in the crypto “bank” world:

  • On 4/25, Matt Levine interviewed Sam Bankman-Fried and we caught a glimpse of truth about the crypto ponzis out there. One of the top royal advisors was saying that the emperor had no clothes.
  • On 5/8, the algorithmic “stablecoin” UST broke its $1 peg. 5/9 was worth only 35 cents. 5/12 worth 10 cents. Currently worth about 1 cent.
  • On 5/20, Stablegains, an app promising 15% APY based on UST, shut down abruptly with customers altogether losing over $40 million.
  • On 6/13, Celsius suddenly froze all withdrawals for their 1.7 million customers.
  • On 6/20, Babel Finance, which refers to itself as the “world’s leading comprehensive crypto financial service provider”, limited customer withdrawals to only $1,500 per month.
  • On 6/23, Voyager Digital set a $10,000 daily withdrawal limit. Apparently Voyager made a $600 million loan to a hedge fund called 3AC that is in default. Voyager total assets are under $150 million! Now Voyager itself has taken out a $200 million line of credit to survive (and pay out customer withdrawals… for now).
  • …to be continued.

The promise behind all of these crypto loans was that they were “over-collateralized” and “asset-backed”. This usually meant a $1 million loan in exchange for collateral of $2 million in Bitcoin. In theory, they should just sell the Bitcoin collateral when it drops by 50% and always get their $1 million back. Sounds reasonable? So what happened? Other lenders like BlockFi and Genesis did perform a margin call and sell out 3AC’s positions. I’m not sure why Voyager did not. In my opinion, this put into question every other lender out there. I feel like a bank customer in the 1800s that overheard an anxious whisper.

I have withdrawn nearly all of my assets from various exchanges like BlockFi, Coinbase, Gemini, Voyager, etc. I did put a small amount of experimental money into high interest stablecoin accounts, but have withdrawn those as well. Even if you are long crytpo, you still need to survive the crashes. You can move your coins into an offline cold wallet (but don’t forget the password!). You could transfer your crypto into what you consider a safer custodian. You could sell and withdraw the cash (just to get it out) and reinvest elsewhere.

Coinbase is the largest US-based cryptocurrency exchange, still worth over $12 billion dollars as of this writing. However, it is still true that a bankruptcy could wipe out whatever you keep in your Coinbase account:

Coinbase said in its earnings report Tuesday that it holds $256 billion in both fiat currencies and cryptocurrencies on behalf of its customers. Yet the exchange noted that in the event it ever declared bankruptcy, “the crypto assets we hold in custody on behalf of our customers could be subject to bankruptcy proceedings.” Coinbase users would become “general unsecured creditors,” meaning they have no right to claim any specific property from the exchange in proceedings. Their funds would become inaccessible.

Even if Bank of America, Chase, Vanguard, and Fidelity all went bankrupt, I would still have the same cash and same ownership share of businesses due to US laws and regulation. Crypto exchanges “feel” like an FDIC member bank or a SIPC member brokerage account, but they aren’t the same and your deposits do not have the same protections.

Counterparty risk is a big reason why many institutions prefer to trade Bitcoin futures on the CME.

Bottom line. This is NOT a prediction about the future value of Bitcoin itself. I don’t think all crypto is completely worthless, but I do think that crypto exchange bankruptcies will happen. If you have assets at a crypto exchange earning interest, that means they have lent your assets out. In reality, you are the unsecured creditor of a young business in a risky industry. Even if a stablecoin like USDC remains worth $1, if your crypto custodian fails then you can still lose it all. So I moved it out. I don’t want to be at the end of a very long line, waiting to ask for my money back.

Schwab Hidden Fees: $187 Million Penalty For Intelligent Portfolios Robo-Advisor

via GIPHY

Schwab has agreed to pay a $187 million SEC settlement due to being sneaky about the fees charged by their robo-advisor product, Schwab Intelligent Portfolios (SIP). Schwab used “free” but quietly forced its own customers to hold a lot of cash in an high-cost form where they can skim off fees (and you get paid less interest). It was a relatively open secret in the financial planning industry, as noted in my own Intelligent Portfolios review:

Schwab makes a ton of money on your idle cash, and it is NOT an accident that they force you to own cash in their automated portfolios.

However, the details of this SEC settlement show that their behavior was even worse than I initially thought. As explained by Matt Levine in Money Stuff, Schwab literally decided how much profit they wanted first, and then worked their model asset allocations around that number. The technical version:

Each of SIP’s model portfolios held between 6% and 29.4% of clients’ assets in cash. The amount of cash that each SIP model portfolio contained was pre-set so that Respondents’ affiliate bank would earn at least a minimum amount of revenue from the spread on the cash by loaning out the money. …

In order to offer SIP without charging an advisory fee, Schwab management decided that the SIP portfolios would collectively hold an average of at least 12.5% of their assets in cash. To meet that goal, management set the exact amount of cash in each of SIP’s model portfolios, with the most aggressive portfolio containing 6% cash and the most conservative portfolio 29.4%, based in large part on its analysis that Schwab Bank would make a minimum amount of revenue at these levels. Management then provided these pre-set cash allocations to CSIA. In building the SIP model portfolios, CSIA treated the cash allocations provided by management as constraints and did not alter or adjust the cash allocations in any way. …

On February 18, 2015, weeks before the SIP launch, two articles were published in the media that were critical of SIP, claiming that the drag from the high cash allocations was a hidden cost of the program. In reaction to these articles, Schwab management directed that the SWIA ADV brochure be re-written, and that a public relations campaign be launched to explain the SIP cash allocations. …

While the ADV brochures disclosed that Schwab Bank earned income from the cash allocation for each investment strategy, SWIA’s and CSIA’s ADV brochures stated that the cash allocations in the SIP portfolios were “set based on a disciplined portfolio construction methodology designed to balance performance with risk management appropriate for a client’s goal, investing time frame, and personal risk tolerance, just as with other Schwab managed products.” This was false and misleading because the cash allocations were actually pre-set in order to reach minimum revenue targets for the Respondents.

Here it is more accurately summarized in this Reuters quote:

“Schwab claimed that the amount of cash in its robo-adviser portfolios was decided by sophisticated economic algorithms meant to optimize its clients’ returns when in reality it was decided by how much money the company wanted to make,” SEC enforcement chief Gurbir Grewal said.

Here’s what Schwab says in their press release:

We are proud to have built a product that allows investors to elect not to pay an advisory fee in return for allowing us to hold a portion of the proceeds in cash, and we do not hide the fact that our firm generates revenue for the services we provide.

Really, you don’t hide the fact? Let’s look at your product page now as of 6/15/2022. This is what you see without clicking further:

We believe cash is a key component of an investment portfolio. Based on your risk profile, a portion of your portfolio is placed in an FDIC-insured deposit at Schwab Bank. Some cash alternatives outside of the program pay a higher yield.

What else is not mentioned on their product page? The actual interest rate paid. The APY is not mentioned anywhere on that page, even through a link or fine print. You must go searching for this link, where you will find that SIP actually holds special “Sweep Shares” of the Schwab Government Money Fund (SWGXX) with a annual expense ratio of 0.44% and SEC yield of 0.38% as of 6/15/22. In comparison, Vanguard’s default cash sweep is the Vanguard Federal Money Market Fund (VMFXX) with a net expense ratio of 0.11% and SEC yield of 0.76% as of 6/15/22.

If you click further, you find their new fine print:

Assume a $100,000 account with a 10% Cash Allocation ($10,000), which would be a moderate—aggressive investment portfolio allocation. Using market interest rates from the first quarter of 2022, Schwab Bank earned about 1.03% on an annual basis on the cash it invested net of what it paid to clients in the Program. Schwab Bank would have received about $103 ($10,000 x 1.03%) on that cash deposit, annualized, which equates to 0.103% or 10.3 basis points ($103/$100,000) of the total client investment of $100,000.

However, the true cost to investors is not just the fees that Scwhab gets. Cash is not necessarily ideal for long-term portfolios. By dictating cash, you ignore other higher-yielding and arguably more appropriate options like their own Schwab Short-Term U.S. Treasury ETF (SCHO, 0.04% ER, 2.60% SEC yield) and Schwab Short-Term Bond Index Fund (SWSBX, 0.06% ER, 2.98% SEC yield).

Schwab customers are at this very moment, losing significant money from their high-cost cash drag instead of a low-cost, high-quality money market and/or short-term bond fund. Schwab customers should note that this quiet profit via cash holding motive runs throughout the company. The Schwab Bank “High Yield” Investor Savings account pays 0.05% APY. Uninvested bank sweep cash in your Schwab brokerage and retirement accounts pays a measly 0.01% APY.

I would bet that if you did a poll of all Schwab IP customers and asked them about it, a majority would have no idea about this arrangement.

Bottom line. After reading the details of this SEC settlement, the fact that Schwab put profit first and the actual design of the product second is the most offensive. I’d much rather you sell me a great product at a fair price. Schwab’s reputation is now lower in my mind. They have some good products, but I would not recommend Schwab Intelligent Portfolios (or any Schwab managed product based on their behavior here) for my family or friends.

Teachers Federal Credit Union New Member Promotion (DO NOT TRY)

Update 6/16/22: More than two weeks after joining and taking my deposit, they have finally refunded the deposit and officially declined my application due to vague reasons suggesting fraud. They have made no effort to contact me or to otherwise explain their actions. I’d never use this credit union, even if I lived in their region. 🙄

Update 6/13/22: Myself and many other readers report that this credit union has locked them out of online access and refunded the initial deposit, all without any further communication. All after approving the account, providing account numbers and routing numbers, and allowing us to set up direct deposits. Not a great look for them. I would not try for this bonus anymore if you have not already done so.

Original post as of 5/30/22:

Teachers Federal Credit Union has a new member offer worth up to $400 that consists of a $300 direct deposit bonus and $100 debit card spending bonus. The terms also state that you can stack this with the $50 refer-a-friend promotion. Teacher’s FCU has 32 physical branches in New York state, but membership is open to anyone applying online. Must enter promo code OFFER400 to participate in this offer. Hat tip to DepositAccounts. Offer ends 7/31/22.

$300 Direct Deposit bonus details.

  • Offer available to new members only.
  • Must enroll in Online Banking and eStatements.
  • Open a new Teachers checking account.
  • Have qualifying direct deposits totaling at least $2,500.00 within the first three monthly statement cycles after account opening.
  • Qualifying direct deposits include payroll or government benefits. Transactions that will not count toward direct deposits include external transfers, point of sale credits and in-person check or cash deposits, wire transfers, ATM transfers, and Online and Mobile Banking transfers.
  • For accounts opened online, you must use offer code OFFER400 to be eligible.
  • May be combined with the Refer-a-Friend promotion.

$100 Debit Card Spend bonus details.

  • Offer available to new members only.
  • Must enroll in Online Banking and eStatements.
  • Open a new Teachers checking account with a debit card.
  • Make $500 in eligible purchases using the Teachers debit card linked to that account.
  • The $500 must be spent within the first three monthly statement cycles in order to qualify. Qualifying debit card purchases do not include: ATM transactions, cash-back, Peer-to-Peer (“P2P”) payments, loan payments, account funding and disputed or unauthorized transactions.
  • For accounts opened online, you must use offer code OFFER400 to be eligible.
  • May be combined with the Refer-a-Friend promotion.

$50 Refer-a-Friend bonus details.

  • Referred person must keep account open for 60 days in good standing with a balance greater than $0.
  • Referred person must perform 10 qualifying transactions in 60 days – transactions include debit card purchases, direct deposits, mobile deposits, Teachers bill pay, in-branch deposits and ATM deposits
  • If these requirements are satisfied, both the referrer and referred person will each get a $50 bonus deposited into their Regular Savings account.
  • Here is my $50 refer-a-friend link. Enter your e-mail address to use. Thanks if you use it!

Smart Checking 1.00% APY details. There is a barebones Share Draft Checking with no minimum balance and no monthly fee, but also no interest paid. Alternatively, the high yield Smart Checking account earns 1.00% APY on balances up to $15,000 (and 0.10% APY on balances greater than $15,000) when you meet one of these qualifications:

  • Average monthly balance of $5,000 in your Smart Checking account
  • $20,000 in combined end of month deposit balances
  • Establish direct deposit(s) of $500 or more AND complete 10 debit card purchases each month

(Note that there is a inactivity fee if the Share Savings account balance falls below $100 AND there has been no account activity during the previous two years.)

Application and bonus qualification details. Here are some tips based on my account opening experience.

  • First, start by clicking on a $50 refer-a-friend link from a member and enter your e-mail address. This qualifies you for the $50 Refer-a-friend offer and you will move on to the application process. You can pick either the Share Draft Checking or Smart Checking (both have no monthly fee).
  • You will enter your personal information including name, address, drivers license/ID, Social Security number, and so on. They will ask you some identity verification questions. You will not have to join any special organizations to gain credit union membership, not even a $5 nominal fee. In fact, they will deposit $1 for you into a savings account to get you started.
  • Be sure to enter the promo code OFFER400 when prompted towards the end of the application.
  • Your initial deposit can be charged on a credit card, up to $5,000. I recommend using a 2% cash back card or similar to earn some rewards. If everything goes smoothly, you should receive an e-mail with your member number shortly, which allows you to sign up for online access. Otherwise, they may ask for some additional documentation.
  • They seem to be pretty good about frequent email communication. Once you get the account number (routing number is 221475786), you can use that for establishing direct deposit within the required timeframe. (Note the offer page says 60 days in some places, but the fine print clarifies it is within three monthly statement cycles.) Don’t forget to sign up for eStatements and make those 10 transactions as well to get the $50 referral bonus.

Altogether, this is a very attraction promotion on a pretty decent no-fee checking account. Teachers FCU also has competitive CD rates at times. They currently offer a unique 24 month “Smart CD” that pays 2.00% APY in Year 1 and 2.50% APY in Year 2 (as of 5/30/22).

Cash Rates Early Update: 5-Year CDs at 3% APY, 5-Year MYGA Rates at 3.65%

I’m going to wait a bit on my full May interest rate update, as I expect more rate changes early this week. Even the rates quoted below may become outdated quickly, but I wanted to point out certain rates at multi-year highs and also near the psychological 3% level. Here are a few examples as of 5/1/22:

  • Brokered CD rates: 3.05% APY for 5-year CDat Vanguard and Fidelity fixed income desks (non-callable, Capital One and Goldman).
  • Credit union CD rate: 3.03% APY for 5-year certificate at Department Of Commerce Federal Credit Union.
  • US Treasury Bonds: 2.97% yield to maturity at 5 years length, secondary market.
  • Fixed Annuity: 3.65% rate on 5-year MYGA from The Standard (A Rating) on 5/2/22 via Blueprint Income. Possibly as high as 3.85% with $100,000 at Stan the Annuity Man (varies by state). Learn more about MYGAs here and here.

I have no idea where rates will go from here. They may go much higher. 🤷 I haven’t decided when to lock in something, but I’m definitely paying attention.

INVEST: New American Express and Vanguard Co-Branded Robo-Advisor

I had to double-check the date when I received the press release for this product to make sure it wasn’t April 1st. 🤯 INVEST is a new partnership between Vanguard and American Express, but Vanguard provides all of the financial investment advice. More accurately, Vanguard is paying a credit card company to find new customers and charging those new customers higher prices to cover the marketing costs. Yes, the same Vanguard that made its brand by putting its customers first, selling direct, and not paying sales commissions to financial advisors though big upfront loads on mutual funds. Somebody please create an animated GIF with Jack Bogle shaking his disappointed head. 😞

Another step towards the “New” Vanguard(TM). I wonder how many “consultants” were involved. Ah well, I suppose I should take a closer look anyway.

  • Annual gross advisory fee of 0.50%. (Waived for the first 90 days.)
  • Minimum $10,000 to eligible assets to start.
  • Includes Vanguard’s digital advisory platform.
  • Access to a 30-minute consultation where you can talk with a Vanguard advisor.
  • If you maintain $100,000 or more in your account(s) managed by INVEST, you get ongoing access to “an unlimited number of advisory phone calls”
  • Bonus American Express Membership Rewards® points annually based on the average annual taxable assets: 5,000 points for $50,000+, 25,000 points for $100,000+, 50,000 points for $500,000+.
  • Interest boost on American Express High Yield Savings Account. Get $15 for every $10,000 in average daily balance over the last 12 months (up to $50,000) in your Amex Savings account.

We basically have a few add-ons wrapped around the basic Vanguard Digital Advisor Services (VDAS) product (my review). As a reminder, VDAS sets you up with a model portfolio of low-cost Vanguard index ETFs and charges an annual gross advisory fee of only 0.20% and a lower minimum investment of $3,000.

So let’s add on the perks. Everyone gets a one-time 30-minute phone call. Thirty whole minutes! With a real, live human! If you give them $100,000, then you get unlimited phone calls. They don’t promise access to certified financial planners or anything specific. But if you had $50,000 to invest, you could alternatively upgrade to Vanguard Personal Advisory Services (VPAS) which also includes access to human advisors and more complex advice. VPAS charge an annual advisory fee of 0.30% on top of the expenses from underlying investments. Add on the estimated 0.05% from a model underlying ETF portfolio, and you’d have 0.35%.

For the bonus points, using a value of of 1 cent per Membership Rewards point, the bonus works out to a $50 value on exactly a $50,000 balance, or 0.10%. But that’s a little deceiving because you need $10,000 to open an account. That makes the bonus worth only 0.05%. $250 value on exactly a $100,000 balance is 0.25%. $500 value on exactly a $500,000 balance is 0.10%. So $100,000 is the sweet spot, but the cutoff is a bit severe if you miss it.

For the savings account interest boost, you are adding about 0.15% to the interest rate at the most optimistic on the AmEx online savings account. Their current rate is 0.50% APY. That’s about the same as most “high yield online savings accounts”, but comparison shoppers can almost always do much better. I wouldn’t really consider this a worthwhile bonus since 0.15% is not a significant margin when you don’t know if the base rate will stay competitive.

To summarize, the added perks do not reliably offset the higher cost of this product when compared to going directly through Vanguard.

Vanguard, known for not paying commissions to financial advisors…. is paying a commission to American Express. So why are you paying 0.15% to 0.30% more annually than going direct through Vanguard? Well, you should know that up to half of the fees that you pay will go directly into American Express’s pocket.

American Express (Amex) will receive a promoter fee in an amount that is up to 50% of the advisory fee that you pay to Vanguard Advisers, Inc. (VAI) if you enroll in INVEST. The promoter fee Amex receives will be reduced by certain costs, including the cost of your advisory calls with VAI Financial Advisors and other benefits that provide an incentive for you to consider INVEST. This promoter fee will be paid by VAI to Amex for so long as you maintain your advisory relationship with VAI.

Is this the most evil thing ever? No. You can always argue that anything that exposes people to investing is good, even if it’s a bit more expensive than necessary. I’m still disappointed. Vanguard was different because it was boring with little advertising and letting the product sell itself.

Bottom line. INVEST has Vanguard’s robo-advisor at its core but with a higher costs and added perks. The added perks do not reliably offset the higher cost of this product when compared to going directly through Vanguard. The reason for this is that… wait for it…. costs matter. Vanguard has to pay American Express a cut of half of your fees forever for this marketing relationship, which eventually lowers your returns as an investor. I wonder what company taught me that?!

via GIPHY

MMB Humble Portfolio 2022 1st Quarter Update: Asset Allocation & Performance

portpie_blank200Here’s my quarterly update on my current investment holdings as of 4/8/22, including our 401k/403b/IRAs and taxable brokerage accounts but excluding a side portfolio of self-directed investments. Following the concept of skin in the game, the following is not a recommendation, but just to share an real, imperfect, low-cost, diversified DIY portfolio. The goal of this “Humble Portfolio” is to create sustainable income that keeps up with inflation to cover our household expenses.

TL;DR changes: Both stocks and bonds went down a small bit. Slightly overweight REITs, slightly underweight International Stocks. As usual, collected dividends and interest and reinvested available leftover cash.

Actual Asset Allocation and Holdings
I use both Personal Capital and a custom Google Spreadsheet to track my investment holdings. The Personal Capital financial tracking app (free, my review) automatically logs into my different accounts, adds up my various balances, tracks my performance, and calculates my overall asset allocation. Once a quarter, I also update my manual Google Spreadsheet (free, instructions) because it helps me calculate how much I need in each asset class to rebalance back towards my target asset allocation. I also create a new tab each quarter, so I have snapshot of my holdings dating back many years.

Here are updated performance and asset allocation charts, per the “Allocation” and “Holdings” tabs of my Personal Capital account.

Stock Holdings (same as last quarter)
Vanguard Total Stock Market (VTI, VTSAX)
Vanguard Total International Stock Market (VXUS, VTIAX)
Vanguard Small Value (VBR)
Vanguard Emerging Markets (VWO)
Avantis International Small Cap Value ETF (AVDV)
Cambria Emerging Shareholder Yield ETF (EYLD)
Vanguard REIT Index (VNQ, VGSLX)

Bond Holdings
Vanguard Limited-Term Tax-Exempt (VMLTX, VMLUX)
Vanguard Intermediate-Term Tax-Exempt (VWITX, VWIUX)
Vanguard Intermediate-Term Treasury (VFITX, VFIUX)
Vanguard Inflation-Protected Securities (VIPSX, VAIPX)
Fidelity Inflation-Protected Bond Index (FIPDX)
iShares Barclays TIPS Bond (TIP)
Individual TIPS bonds
U.S. Savings Bonds (Series I)

Target Asset Allocation. This “Humble Portfolio” does not rely on my ability to pick specific stocks, sectors, trends, or countries. I own broad, low-cost exposure to asset classes that will provide long-term returns above inflation, distribute income via dividends and interest, and finally offer some historical tendencies to balance each other out. I have faith in the long-term benefit of owning publicly-traded US and international shares of businesses, as well as high-quality US Treasury and municipal debt. My stock holdings roughly follow the total world market cap breakdown at roughly 60% US and 40% ex-US. Some minor wrinkles are the inclusion of “small value” ETFs for US, Developed International, and Emerging Markets stocks as well as additional real estate exposure through US REITs.

I strongly believe in the importance of knowing WHY you own something. Every asset class will eventually have a low period, and you must have strong faith during these periods to truly make your money. You have to keep owning and buying more stocks through the stock market crashes. You have to maintain and even buy more rental properties during a housing crunch, etc. A good sign is that if prices drop, you’ll want to buy more of that asset instead of less. I don’t have strong faith in the long-term results of commodities, gold, or bitcoin – so I don’t own them. Simple as that.

I do not spend a lot of time backtesting various model portfolios, as I don’t think picking through the details of the recent past will necessarily create superior future returns. Usually, whatever model portfolio is popular in the moment just happens to hold the asset class that has been the hottest recently as well.

Find productive assets that you believe in and understand, and just keep buying them through the ups and downs. Mine may be different than yours.

Stocks Breakdown

  • 45% US Total Market
  • 7% US Small-Cap Value
  • 31% International Total Market
  • 7% International Small-Cap Value
  • 10% US Real Estate (REIT)

Bonds Breakdown

  • 66% High-Quality bonds, Municipal, US Treasury or FDIC-insured deposits
  • 34% US Treasury Inflation-Protected Bonds (or I Savings Bonds)

I have settled into a long-term target ratio of 67% stocks and 33% bonds (2:1 ratio) within our investment strategy of buy, hold, and occasionally rebalance. This is more conservative than most people my age, but I am settling into a more “perpetual income portfolio” as opposed to the more common “build up a big stash and hope it lasts until I die” portfolio. My target withdrawal rate is 3% or less. With a self-managed, simple portfolio of low-cost funds, we can minimize management fees, commissions, and taxes.

Holdings commentary. I know I sound like a broken record, but really, my best investment decisions have been convincing myself to do nothing during times of stress. Sometimes it was easy, sometimes it was hard. Still, after investing steadily for over 15 years, my results have exceeded my expectations and the fluctuations are now often greater than my annual spending. To make it easier, I try to ignore daily talk about stock movements.

There is ALWAYS something that looks worrying. I am a “buy, hold, and cash the checks” kind of investor. I often wonder how I can teach my children such patience in investing, and that seems to be the hardest aspect.

Performance numbers. According to Personal Capital, my portfolio down about 6% for 2022 YTD. US stocks, International stocks, and even US bonds are all down roughly 6-8%. REITs are the only things that went up. As such, in terms of rebalancing, the portfolio is slightly overweight in REITs and slightly underweight in International Stocks, so that is where the excess cash will be invested this quarter.

I’ll share about more about the income aspect in a separate post.

Marcus Bank CD Promo: 1.10% APY for 10-Month Term, Rising Rate Commentary

Rates are rising… slowly. Marcus Bank has a 10-month promo CD paying 1.10% APY ($500 min, early withdrawal penalty is 90 days of interest). Ally Bank has a 14-month promo CD paying 1.00% APY (No min, early withdrawal penalty is 60 days of interest). If you have a short-term window, these (sadly) are competitive rates. I figure I should mention them, although you can also get 1%+ APY from a liquid savings account if you know where to look.

Personally, I’m only keeping my cash in short-term lock-ups with high effective APYs like the deposit promos recently from CIT Bank (still live) and Live Oak Bank (probably too late if you haven’t started) and Marcus Bank (already expired).

Overall, I definitely don’t on locking in any 5-year CDs due to the mix of current low rates and impending possibility of higher rates soon. Inflation numbers are still elevated. However, I also don’t expect to see significantly higher rates on savings accounts right away. Banks tend to raise their rates on credit cards first and by a lot, and savings account last and by a little. Via Axios (notice the different scales!):

Notes on Berkshire Hathaway 2021 Annual Letter to Shareholders by Warren Buffett

Berkshire Hathaway (BRK) released its 2021 Letter to Shareholders over the weekend, which is how Warren Buffett updates his fellow shareholders annually on the status of the business. Direct ownership of Berkshire Hathaway shares (above my passive index fund allotment) was one of my first “explore” investments where I set aside a percentage of my portfolio to buy something that wasn’t an index fund for both educational and profit purposes. The education has been very valuable, possibly worth more than the investment gains. This year’s letter is only 10 pages long. Here are my personal highlights.

Investing is not always about pure optimization. It is better to have a reasonable plan that you understand and can keep the faith in times of stress. I think about my index fund portfolio and BRK shares the same way: The price may fluctuate in the short-term, but earnings power will continue to increase in the long-term and there will be as close to 0% chance of permanent loss as possible.

To a truly unusual degree, however, Berkshire has as owners a very large corps of individuals and families that have elected to join us with an intent approaching “til death do us part.” Often, they have trusted us with a large – some might say excessive – portion of their savings.

Berkshire, these shareholders would sometimes acknowledge, might be far from the best selection they could have made. But they would add that Berkshire would rank high among those with which they would be most comfortable. And people who are comfortable with their investments will, on average, achieve better results than those who are motivated by ever-changing headlines, chatter and promises.

Owning quality businesses, either wholly or partially. BRK seeks to own only quality businesses. They find the needles in the haystack. Index funds own the whole haystack.

Whatever our form of ownership, our goal is to have meaningful investments in businesses with both durable economic advantages and a first-class CEO. Please note particularly that we own stocks based upon our expectations about their long-term business performance and not because we view them as vehicles for timely market moves. That point is crucial: Charlie and I are not stock-pickers; we are business-pickers.

Easier to find mis-pricing amongst common stocks.

One advantage of our common-stock segment is that – on occasion – it becomes easy to buy pieces of wonderful businesses at wonderful prices. That shooting-fish-in-a-barrel experience is very rare in negotiated transactions and never occurs en masse. It is also far easier to exit from a mistake when it has been made in the marketable arena.

Personal asset allocation varies between 80% and 100% stocks. Here was an interesting peek about his personal stock allocation over the last 80 years. Buffett has never been shy about owning stocks where he believes that there is a good margin of safety because he paid a a price below intrinsic value.

Nor have Charlie and I lost our overwhelming preference for business ownership. Indeed, I first manifested my enthusiasm for that 80 years ago, on March 11, 1942, when I purchased three shares of Cities Services preferred stock. Their cost was $114.75 and required all of my savings. (The Dow Jones Industrial Average that day closed at 99, a fact that should scream to you: Never bet against America.)

After my initial plunge, I always kept at least 80% of my net worth in equities. My favored status throughout that period was 100% – and still is. Berkshire’s current 80%-or-so position in businesses is a consequence of my failure to find entire companies or small portions thereof (that is, marketable stocks) which meet our criteria for long- term holding.

Most stocks are too expensive right now. That will eventually change.

Charlie and I have endured similar cash-heavy positions from time to time in the past. These periods are never pleasant; they are also never permanent. And, fortunately, we have had a mildly attractive alternative during 2020 and 2021 for deploying capital. Read on.

The only thing attractive was Berkshire stock itself. So they bought that. Existing shareholders own ~10% more of Berkshire than they did a couple years ago. Side note: You know when I buy some more BRK shares? When WEB does.

Periodically, as alternative paths become unattractive, repurchases make good sense for Berkshire’s owners. During the past two years, we therefore repurchased 9% of the shares that were outstanding at yearend 2019 for a total cost of $51.7 billion. That expenditure left our continuing shareholders owning about 10% more of all Berkshire businesses, whether these are wholly-owned (such as BNSF and GEICO) or partly-owned (such as Coca-Cola and Moody’s).

The orangutan effect. I found this quote very true, as writing on this blog helps me develop and clarify my thoughts. But did I just get called an orangutan?

Teaching, like writing, has helped me develop and clarify my own thoughts. Charlie calls this phenomenon the orangutan effect: If you sit down with an orangutan and carefully explain to it one of your cherished ideas, you may leave behind a puzzled primate, but will yourself exit thinking more clearly.

Past shareholder letters.

  • 1977-2021 are free on the Berkshire Hathaway website (PDF). 1965-2020 are $2.99 at Amazon (Kindle). Three bucks seems pretty reasonable for a permanent digital copy with the ability to search text and maintain highlights.
  • 2020 Letter notes
  • 2019 Letter discussed why BRK will continue to do fine without Warren Buffett around.
  • 2018 Letter discussed using debt very sparingly and the importance of holding productive assets over a long time.
  • 2017 Letter discussed patience, risk, and why they have so much cash.
  • 2016 Letter touched on the rarity of skilled-stock pickers and some insight on his own stock-picking practices.
  • 2015 Letter discussed his optimism in America and his “Big 4” stock holdings.
  • 2014 Letter discussed the power of owning shares of productive businesses (and not just bonds).
  • 2013 Letter included Buffett’s Simple Investment Advice to Wife After His Death.

The annual shareholder meeting will be in-person this year. Unfortunately, this will not be the year I finally get to go. CNBC will livestream it on Saturday, April 30th. I’ll try to watch it while eating some See’s peanut brittle and bridge mix.

Schwab Lifetime Adjustable Income: Flexible Withdrawal Rules Based On Portfolio Survival Chances

One of the perpetual debates in retirement planning circles is withdrawal rates, AKA how much monthly income can you take from a portfolio. Once you nail down a withdrawal rate and retirement spending target, then you get Your Number – how much you need to have saved to retire (after backing out Social Security and other income streams). It’s common to start with the static 4% rule, but that rule also includes some drawbacks. An alternative is a flexible withdrawal rule that adjusts based on market returns. When your portfolio grows, you can spend a little more. If it shrinks, you cut back a little. Sounds reasonable, right?
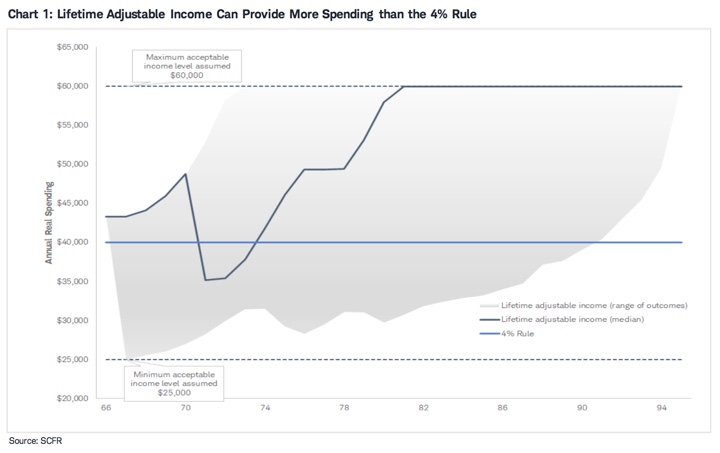
However, I haven’t seen many real-world examples of flexible withdrawal rules. Schwab has helpfully outlined one proposed method in this memo: Lifetime Adjustable Income vs. the 4% Rule: Can You Spend More in Retirement with Less Risk? This provides the underlying basis behind their robo-advisor feature called Intelligent Income where you can pick a comfort level and the software will tell you how much you can withdraw each year and from which type of account (IRA, Roth IRA, taxable, etc).

In this memo, we compare a flexible withdrawal strategy to the static 4% rule. We recommend a lifetime adjustable income strategy, described in this paper, that can be put into action using an annually updated financial plan, using technology or an advisor. Doing so may help increase spending early in, and over a long, retirement and help ensure your money lasts.

Here’s their example structure for flexible withdrawals:

  • Set an initial withdrawal rate that delivers an 80% probability of success (savings lasting).
  • Adjust spending amounts after each year based on if the probability of savings lasting falls outside the range you decide: here it is below 75% or above 99%. If these thresholds are crossed, increase or decrease spending by the amount that brings the financial plan back to a 99% probability of savings lasting. This results in fewer but more drastic cuts.
  • Add “guardrails”. A minimum and maximum acceptable annual (real) spending amount of $25,000 and $60,000, respectively, meaning that we will always withdraw at least $25,000 (or at most $60,000).

Using these flexible rules, the initial withdrawal rate was about $43,000 instead of $40,000. Across all of the simulated scenarios, the average annual withdrawal was basically 20%, or $10,000 a year, higher: $50,000 a year instead of the $40,000 a year (in today’s dollars). Even better, the likelihood of running out of money dropped.

However, you must look past the averages and see that you are now exposed to the extremes. Look at that wide expanse of grey. A significant number of the scenarios involved some extended deep cuts to spending, hitting and hovering just above the $25,000 minimum guardrail. You’ll have to decided if you like this trade-off between probably getting more income but possibly enduring some big cuts. This is why many financially-conservative people would prefer to simply start out at a lower 3% or 3.5% withdrawal rate and adjust upwards if the portfolio keeps growing.

In any case, I found it interesting that Schwab used the probability of portfolio survival rate as the factor used to adjust withdrawal rate. DIY investors can implement a similar system themselves. Here are some tools to estimate portfolio survival probability: