Search Results for: Buying Stocks

Howard Marks Memo on High Stock Market Prices and Risk Management

marksbarrons
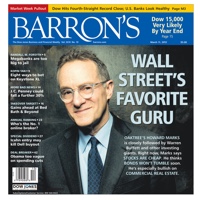
There seems to be a lot of angst about the stock market these days. It’s been going up, up, up. Is it too high? Will there be a crash? Accordingly, I just caught up on the most recent Howard Marks memos – There They Go Again… Again [pdf] and the follow-up Yet Again?. Everyone from Warren Buffett on down reads these memos to Oaktree Capital clients.

The first memo contains mostly cautionary advice about how asset prices are high, prospective returns are low, and high-risk behavior is commonplace. We are in the midst of high uncertainty in terms of central banks, politics, technology, future jobs, and more. Yet stocks are at historically high-valuations and risky bonds (junk corporate, emerging markets) are priced at historically-tiny premiums to Treasury bonds.

A common explanation for these thing is that interest rates are low, so the prices of stocks and bonds are justifiable. Therefore, I found this quote interesting:

The bottom line is that while the prices and prospective returns on many things are justifiable today relative to other things, you can’t eat (or spend) relative returns.

In other words, just because you can justify it doesn’t mean you should buy it.

The second memo tries to respond to criticisms and also provide additional guidance. It’s easy to point out flaws. It’s harder to lay out clear and actionable advice. Investing in low-cost index funds is not perfect and has many drawbacks. But what is better?

What should an investor actually DO with high asset values everywhere? Marks offers the following choices:

1. Invest as you always have and expect your historic returns.
2. Invest as you always have and settle for today’s low returns.
3. Reduce risk to prepare for a correction and accept still-lower returns.
4. Go to cash at a near-zero return and wait for a better environment.
5. Increase risk in pursuit of higher returns.
6. Put more into special niches and special investment managers.

For the most part, he dismisses #1, #4, and #5. This leaves:

For me the answer lies in a combination of numbers 2, 3 and 6.

After digesting these Howard Marks memos, here are my personal takeaways and opinions:

  • Adjust your future return expectations to be lower than historical averages.
  • Make sure your portfolio is stress-tested. If a 50% drop in your stocks would freak you out, then reduce your risk slightly by selling a bit of stocks and buying a bit of short-term, high-quality bonds (or cash). Don’t go 100% cash, but do take some risk off the table if necessary.
  • You might simply keep your portfolio the same. I’m sticking with 2/3rd stocks (globally-diversified) and 1/3rd bonds (on the shorter-term, higher-quality side).
  • If you are Howard Marks, you might look for “special niches and special investment managers”. If you are not Howard Marks, ignore this option because you’re most likely to do harm than good. If anything take 5% of your portfolio, manage it however you like, and compare your return honestly with your index funds.

Here’s a good quote from a 2007 memo as to the consequences of being cautious:

If you refuse to fall into line in carefree markets like today’s, it’s likely that, for a while, you’ll (a) lag in terms of return and (b) look like an old fogey. But neither of those is much of a price to pay if it means keeping your head (and capital) when others eventually lose theirs. In my experience, times of laxness have always been followed eventually by corrections in which penalties are imposed. It may not happen this time, but I’ll take that risk. In the meantime, Oaktree and its people will continue to apply the standards that have served us so well over the last [thirty] years.

Risk-taking in the capital markets is becoming widely accepted again. Therefore, the contrarian thing is to not increase your risk right now. You may have to give up some possible return, but it is wiser to be prepared. Marks is not a “perma-bear” that always call for an impending crash. If you read the Barron’s cover above it quotes Marks as saying “stocks are cheap” back in March 2013 (paywalled article). Not a bad call in hindsight. Bookmark this article for another hindsight check in 2021/2022.

You can read previous Howard Marks Memos online for free, or as a book with extra commentary in The Most Important Thing.

Book Review: A History of Gold in the United States

onenationgold

Having been born after 1971, I have never lived in a time when the dollar was backed by gold. In an effort to learn more about the gold standard, I recently finished One Nation Under Gold: How One Precious Metal Has Dominated the American Imagination for Four Centuries by James Ledbetter. In other words, this is a history of gold in America. Here are my overall takeaways:

I always thought that the pre-1971 gold standard meant that for every dollar printed, there was a certain amount of gold set aside in a vault. This turns out to be false. A long time ago, gold coins actually circulated as currency. But the more modern version of a gold standard simply means the government agrees to sell gold bullion on demand at a fixed dollar price (ex. $35 for an ounce of gold).

Under the gold standard, countries rarely had enough gold in their vaults to cover if everyone decided to redeem their currency. As a result, countries including the United States were constantly worried about running out of gold and used various political tricks to prevent too many redemptions. If the fixed ratio was $35 an ounce and people could get the equivalent of $36 an ounce somewhere else, there would be a big spike in demand and the US would have to ship out tons of gold. If the vaults went empty, that could cause a financial crisis. The system was constantly under stress.

Every major currency has ended up being forced off the gold standard, usually in times of severe stress. Wars. International trade deficits. Economic depressions. In 1933, the US government was again running low on gold and so they devalued from $20.67/oz. to $35/oz (a devaluation of over 40%). In addition, they banned domestic individuals from owning gold from 1933-1974. (Hmmm… a gold standard where you couldn’t actually get gold…) In 1971, with both the Vietnam War and ongoing trade deficits, Nixon ended international convertibility of the US dollar to gold.

I’ve read that every fiat currency in history has eventually failed. Well, it’s also true that every gold standard in history has eventually failed. Just a thought that kept running through my head while reading this book. Gold-backed currency has its own set of problems.

Harry Browne: Wise investment mind or paid salesman for gold industry? You may have heard of Harry Browne as the creator the Permanent Portfolio: 25% stocks/25% cash/25% long-term bonds/25% gold. Well, this book mostly mentions Browne as a shady doomsday salesman for the gold industry. He wrote books that promoted a specific gold company (Pacific Coast Coin Exchange) and then got paid $100,000 (~$600,000 in 2017 dollars) by that company. That’s not all… The SEC shut down PCCE for having no actual gold in vaults and instead buying things like private jets with the money. Here is a 1974 NY Times article about the company.

The chance that the US goes back on a gold standard is very, very, very small. The gold standard did restrict governmental power, and some people like the sound of that. However, governments like having the ability to expand and contract the money supply to overcome stressful events like war and economic recessions. Will they wield that power wisely and effectively? Mistakes will be made, but I don’t see how they will voluntarily give up that flexibility. The question is not whether fiat currency is perfect, it is about which is better amongst imperfect options.

In the end, perhaps it is better that there is an open market for gold. Today, individuals can exchange gold for dollars and dollars for gold whenever they want. Gold ETFs let you buy gold with few clicks and lower transactional costs than physical gold. If you like market-cap weighting, consider a 1% gold portfolio.

I’m not a history buff in general, and perhaps that is why I found this book rather dry and hard to finish. There is no flowing narrative like a Michael Lewis book. However, I felt like I did learn some useful lessons and I’m glad I finished it.

Early Retirement Portfolio Asset Allocation, 2017 Third Quarter Update

portpie_blank200

Here is an update on my investment portfolio holdings after the third quarter 2017. This includes tax-deferred 401k/403b/IRAs and taxable brokerage holdings, but excludes things like our primary home, cash reserves, and a few other side investments. The purpose of this portfolio is to create enough income to cover our regular household expenses.

Target Asset Allocation. The overall goal is to include asset classes that will provide long-term returns above inflation, distribute income via dividends and interest, and finally offer some historical tendencies to balance each other out. I don’t hold commodities futures or gold as they don’t provide any income and I don’t believe they’ll outpace inflation significantly. I also try to imagine each asset class doing poorly for a long time, and only hold the ones where I think I can maintain faith.

Stocks Breakdown

  • 38% US Total Market
  • 7% US Small-Cap Value
  • 38% International Total Market
  • 7% Emerging Markets
  • 10% US Real Estate (REIT)

Bonds Breakdown

  • 50% High-quality, Intermediate-Term Bonds
  • 50% US Treasury Inflation-Protected Bonds

I have settled into a long-term target ratio is 67% stocks and 33% bonds (2:1 ratio) within our investment strategy of buy, hold, and rebalance. With a self-managed, simple portfolio of low-cost funds, we minimize management fees, commissions, and income taxes.

Actual Asset Allocation and Holdings

aa_portpie_1710

Stock Holdings
Vanguard Total Stock Market Fund (VTI, VTSMX, VTSAX)
Vanguard Total International Stock Market Fund (VXUS, VGTSX, VTIAX)
WisdomTree SmallCap Dividend ETF (DES)
WisdomTree Emerging Markets SmallCap Dividend ETF (DGS)
Vanguard Small Value ETF (VBR)
Vanguard Emerging Markets ETF (VWO)
Vanguard REIT Index Fund (VNQ, VGSIX, VGSLX)

Bond Holdings
Vanguard Limited-Term Tax-Exempt Fund (VMLTX, VMLUX)
Vanguard Intermediate-Term Tax-Exempt Fund (VWITX, VWIUX)
Vanguard High-Yield Tax-Exempt Fund (VWAHX, VWALX)
Vanguard Inflation-Protected Securities Fund (VIPSX, VAIPX)
iShares Barclays TIPS Bond ETF (TIP)
Individual TIPS securities
U.S. Savings Bonds (Series I)

Performance and commentary. According to Personal Capital, which aggregates all of my investment holdings across different accounts, my portfolio has gained 7.41% over the last 6 months since my last update. In the same time period, the S&P 500 has gained 9.21% (excluding dividends) and the US Aggregate bond index has gained 1.34%.

pcport_1710

Things are currently at 69% stocks/31% bonds. For the most part, I continue to invest new money on a monthly basis in order to try and maintain the target ratios. Once a quarter, I also reinvest any accumulated dividends and interest. I don’t use automatic dividend reinvestment. This way, I can usually avoid creating any taxable transactions unless markets are really volatile.

For both simplicity and cost reasons, I am no longer buying DES/DGS and will be phasing them out whenever there are tax-loss harvesting opportunities. New money is going into the more “vanilla” Vanguard versions: Vanguard Small Value ETF (VBR) and Vanguard Emerging Markets ETF (VWO).

I’m still somewhat underweight in TIPS and REITs mostly due to limited tax-deferred space as I don’t want to hold them in a taxable account. My taxable muni bonds are split roughly evenly between the three Vanguard muni funds with an average duration of 4.5 years. I may start switching back to US Treasuries if my income tax rate changes signficantly.

In a separate post, I will track dividend and interest income.

S&P 500 Total Return: Still Doubled From October 2007 to 2017

In early October 2007, the S&P 500 index hit just over 1,500 – an all-time high. You might have been concerned, or you might not have even noticed. Less than 2 years later, the financial crisis occurred and the S&P 500 dropped 50% down to 750 (March 2009). If you were a lump-sum investor, October 2007 would have been the worse month to invest in a rather long time. However, consider this chart via Bloomberg article:

bw_october2017

If you held on through the panic, you broke back even some time in mid-2012 if you include dividends (total return). Four years after hitting bottom, you were again hitting an all-time high. After that, basically all of 2013 was spent reaching new “all-time highs” over and over again. You might have gotten nervous again. Is it time for another drop?

Yet, if you continued to hold on until now (October 2017), even if you had the worst possible timing an pushed all your chips in on October 2007, you would have doubled your money. Over the last 10 years, even after both pushing your chips in at an all-time high and experiencing a 50% drop, you would still have earned over a 7% compounded return.

You could interpret this as pro-stocks, but my takeaway is instead that all-time highs don’t mean much. The price could drop by 50%. The price could go up 100%. We’ve seen that, and thus should be prepared for both. Instead of worrying, try considering either possibility and make a plan.

If stocks keep going up from here, I will ______. If stocks drop 50% from here, I will _______.

In my case, my portfolio could be described roughly as 67% stocks and 33% bonds. If all my stocks dropped 50% and my bonds held steady, then I would end up at 50% stocks and 50% bonds. After a 50% haircut, I would be shaken but hopefully remind myself that stock valuations would look a lot better as well. If I can get up the courage, then I will rebalance back to 67/33. If I turn out to be a scaredy-pants, simply staying at 50/50 should still keep me adequately exposed to any recovery.

University of Berkshire Hathaway: Notes From Annual Shareholders Meeting (Book Review)

univ_brk

If you are a Buffett & Munger follower, you should be intrigued by University of Berkshire Hathaway: 30 Years of Lessons Learned from Warren Buffett & Charlie Munger at the Annual Shareholders Meeting by Daniel Pecaut and Corey Wrenn. Anyone can buy all the old BRK shareholder letters, but there are very few transcripts from the live shareholder meetings in Omaha, Nebraska (1986–2015). There is definitely overlap, but these live interactions sometimes provide a peek into their less-publicized opinions (especially Munger’s). Here’s how the authors describe the book:

This book isn’t for the first-time investor. It’s for the informed investor who sees the value of being able to get deep into the mindsets of Warren Buffett and Charlie Munger. If you want to walk around in their shoes for the past three decades, absorb what works, and then apply it to your own investments, then this book is for you.

The current price is only $0.99 in Kindle format. At that price, it should be an easy decision on whether to own the entire book forever, but here are my personal notes and highlights to give you an idea of the contents:

How Berkshire Hathaway differs from other actively-managed stock mutual funds:

The public has long viewed Berkshire as a sort of mutual fund with large stock holdings. This view underestimates or ignores 1) Berkshire’s insurance companies’ impressive generation of low-cost float, 2) Berkshire’s impressive and growing stable of cash-generating operating businesses, and 3) Berkshire’s ability to orchestrate value-enhancing deals.

Classic quote on stock market prices:

Buffett noted that many investors illogically become euphoric when stock prices rise and are downcast when they fall. This makes no more sense than if you bought some hamburger one day, returned the next day to buy more but at a higher price, and then felt euphoric because you had bought some cheaper the day before. If you are going to be a lifelong buyer of food, you welcome falling prices and deplore price increases. So should it be with investments.

Luck and the Ovarian lottery:

Buffett launched into an intriguing thought problem he called “the ovarian lottery.” You are to be born in 24 hours. You are also to write all the rules that will govern the society in which you will live. However, you do not know if you will be born bright or retarded, black or white, male or female, rich or poor, able or disabled. How would you write the rules? Buffett said how one comes out in this lottery is far more important than anything else to one’s future. He and Munger were huge winners having been born American (“in Afghanistan, we wouldn’t be worth a damn”), male (at a time when many women could only be nurses and teachers), white (when opportunities for minorities were slim) and good at valuing businesses (in a system that pays for that like crazy). Buffett noted it is important to take care of the non-winners of the ovarian lottery. Therefore, some sort of taxation is in order. Given that few people with money and talent are turned away from free enterprise under the current system, the 28% capital gains tax is probably okay.

Investing in yourself:

Buffett asserted that the very best investment you can make is in yourself. Buffett shared that, when he talks to students, one of the things he tells them is what a valuable asset they have in themselves. Buffett would pay any bright student probably $50,000 for 10% of their future earnings for the rest of his life. So each student is a $500,000 asset just standing there. What you do with that $500,000 asset should be developing your mind and talent.

State-sponsored legal gambling:

Buffett asserted that to a large extent, gambling is a tax on ignorance. You put it in, and it ends up taxing many that are least able to pay while relieving taxes on those who don’t gamble. He finds it socially revolting when a government preys on its citizens rather than serving them. A government shouldn’t make it easy for people to take their Social Security checks and waste them by pulling a handle. In addition, other negative social things can flow from gambling over time.

Read, read, read:

Buffett agreed that he is big on reading everything in sight and recommended good investors should read everything they can. In his case, he said that by the age of 10, he’d read every book in the Omaha public library on investing, some twice! Fill your mind with competing ideas, and see what makes sense to you.

Investing with real money:

Then you have to jump in the water—take a small amount of money, and do it yourself. He joked that investing on paper is like reading a romance novel versus doing something else. Munger shared that Berkshire Director Sandy Gottesman, who runs a large, successful investment firm (First Manhattan), asks interviewees, “What do you own, and why do you own it?” If you’re not interested enough to own something, then he’d tell you to find something else to do.

Book recommendations, including The Richest Man in Babylon:

We have often recommended to our friends and clients George Clason’s classic, The Richest Man in Babylon, so we were delighted to hear Charlie speak of it. He said that he read the book when he was young and that the book taught him to under-spend his income and invest the difference. Lo and behold, he did this, and it worked.

Munger also suggested that it is very important to learn how to avoid being manipulated by lenders and vendors. He strongly recommended Robert Cialdini’s book, Influence, for the task. He also recommended Cialdini’s newest book, Yes, noting that Cialdini is the rare social psychologist who can connect the world of theory and daily life.

Note: This a dated quote, and Robert Cialdini’s newest book is actually Pre-Suasion: A Revolutionary Way to Influence and Persuade, published in 2016.

Work for yourself an hour each day:

He got the idea to add a mental compound interest as well. So he decided he would sell himself the best hour of the day to improving his own mind, and the world could buy the rest of his time. He said it may sound selfish, but it worked. He also noted that if you become very reliable and stay that way, it will be very hard to fail in doing anything you want.

Simple career advice:

“Do what you enjoy the most. Work for people you admire. You can’t miss if you do that.”

Investing in stocks (equity) vs. bonds (debt):

Buffett noted that the analytical hurdle for buying a bond requires answering the question, “Will the company go out of business?” while buying an equity requires answering the more difficult question, “Will the company prosper?” This is why Berkshire bought the 15% notes of Harley Davidson rather than the stock. He had no question the company would stay in business, quipping, “You have to like a business where the customers tattoo your name on their chests!” But gauging Harley’s long-term prosperity was much more difficult, especially during the throes of the crisis.

Also see my earlier posts on appreciating your absolute standard of living and why you should maintain some optimism.

Bottom line. If you’re a Buffett & Munger enthusiast, this is a nice addition to your collection. Lots of familiar wisdom but also includes some additional perspective. If you’re not a Buffett & Munger enthusiast, I might start elsewhere, for example with Warren Buffett’s Ground Rules if you’re not ready for the original shareholder letters. Here’s to hoping the authors will do a similar book on the Wesco Financial meetings with Charlie Munger.

Does Cash Make You Happier Than Income or Paying Down Debt?

happyfaceThe growing appreciation of behavioral psychology in investing is basically us admitting that we aren’t perfectly rational. When you make people automatically opt-in to 401(k) plans and make their contributions increase automatically, they save more. We value stocks more simply because we own them (“endowment effect”). We hate losing money more than we enjoy winning (“loss aversion”).

A recent research paper tells us (in my own words) that having liquid cash has a stronger correlation effect to happiness than having a bigger retirement portfolio, a higher income, or paying down your debt. This is coming from the NYT article Yes, Numbers Matter in Money Decisions, but So Do Emotions linking to the Kitces post Buying Happiness And Life Satisfaction With Greater Cash-On-Hand Reserves linking to academic paper How Your Bank Balance Buys Happiness: The Importance of “Cash on Hand” to Life Satisfaction. Here’s the abstract:

Our results suggest that having a buffer of money available in checking and savings accounts confers a sense of financial security, which in turn is associated with greater life satisfaction. The strength of this association was comparable to the effect of investments—which may themselves be liquid assets (e.g., money market accounts)—and slightly greater than the effect of debt status. By contrast, higher income and spending—the amounts going into or out of a person’s bank account—were not associated with increased financial well-being after liquid wealth was included in the model. This finding suggests that people with low liquid account balances may feel more economically distressed—and thus less satisfied with their lives—than their peers with higher balances, even if their incomes and spending, considered separately from their account balances, would predict high financial security.

Michael Kitces took the numbers from the paper and created this useful graphic:

cashlife

I dug up some more specific numbers from the paper:

To put our results into context, we found that going from having £1 to having £1,000 (a 3-log increase) in one’s bank accounts each month—not rags-to-riches, but merely rags-to-sufficiency—is associated with an average gain of 2 points (10% of a 20-point scale) in life satisfaction by virtue of feeling more secure about one’s finances. However, because liquid wealth was log transformed, further increasing liquid assets from £1,000 to £10,000 (a 1-log increase) was associated with an expected increase of just 0.7 further points on the same scale.

There are diminishing returns with accumulating cash reserves past a certain size. Going from $1 to ~$1,500 in your bank account improves your life satisfaction more than twice as much as going from ~$1,500 to ~$15,000.

This is similar to the findings that happiness increases with higher income until $60,000 to $75,000 per year. Above that level, happiness still increases but at a much lower rate.

On a certain level, this is common sense. Having a hunk of cash available for emergencies should make you feel more secure. However, in purely mathematical terms you should feel the same if you put $1,500 into your retirement account or if you paid down $1,500 of debt. Money is fungible. But your mind doesn’t necessarily agree, and perhaps it is better to work within that bias rather than fight it.

Bottom line. It may not be rational, but putting money towards a modest cash cushion can make you happier than putting every last penny towards paying down debt or your 401(k) retirement account. After a certain point this “cash is king” effect diminishes. (I might carve out an exception for 401(k) matches that effectively double your money at no risk.)

My Portfolio Asset Allocation Thought Process

portpie_blank200

A reader asked me to expand on the thought process behind my asset allocation choices. I don’t have a highly scientific answer, but here’s how I would explain it to a friend over drinks. Prepare yourself for some rambling…

I know that I could run simulations and backtest return data to figure out exactly which mix of assets have produced the best risk/return characteristics historically. I’ve also looked at various model portfolios based on such analyses. However, perfection can only be seen in retrospect and it is constantly changing. I just try to take away the big nuggets.

The overall goal is to hold asset classes that will provide long-term returns above inflation, distribute income via dividends and interest, and finally offer some historical tendencies to balance each other out.

Stocks Breakdown (Benchmark Ticker)

  • 38% US Total Market (VTI)
  • 7% US Small-Cap Value (VBR)
  • 38% International Total Market (VXUS)
  • 7% Emerging Markets (VWO)
  • 10% US Real Estate (VNQ)

To put it briefly, I am taking the total markets and increasing the portion of one additional asset class which I think has the highest diversification benefits. For example, Small Value is a subset of Total US market, and Emerging Markets is a subset of the Total International market.

38% US Total Market. Instead of “stocks” or “equities”, I prefer to call it “owning businesses”. It’s not just a ticker blip going up and down. I am buying a diversified mix of real businesses that are a critical part of a huge economy. A single company or even a handful of big companies might go bankrupt, but as a whole they are not going anywhere.

The Vanguard Total Stock Market ETF (VTI) holds 3,600 stocks to represent the entire US publicly-listed market from Apple ($770,000 million) to Bridgford Foods Corp. ($100 million). It is market-cap weighted, which means that the amount of each stock held is directly proportional to the total market value of the company. See my VTI review for details.

7% US Small-Cap Value. Historically, small-cap value stocks have produced a higher risk-adjusted return than the entire market. You could also argue that small companies a more representative of the private business market. Therefore, I choose to hold a little more of this asset class via the Vanguard Small-Cap Value ETF (VBR).

You probably haven’t heard of 99% of the stocks in the Small Value index, which is kind of the point. Someone who invests in individual small cap stocks must be wary of that company going bankrupt (or effectively bankrupt). But by owning 828 of these stocks at the same time, I don’t have to worry about VBR ever going to zero (although it can be relatively volatile). Will VBR outperform VTI by a huge margin? Maybe, maybe not, but it probably won’t lag the overall market greatly either.

VTI can be roughly broken down into 85% Large-Cap companies, 10% Mid-Cap companies, and 5% Small-Cap companies. My blend of 85% VTI and 15% VBR is still roughly 72% Large-Cap and 19% Small-Cap. I have “tilted” the amounts, but it’s still predominantly composed of huge businesses like ExxonMobil, Google, and Johnson & Johnson.

International Total Market. The United States is not the only place where businesses create value. Many brands that you deal with every day are listed in foreign countries – Nestle, Shell, Samsung, Toyota, GlaxoSmithKline, Anheuser-Busch InBev. (Bud Light is a foreign company!) The Vanguard Total International Stock ETF (VXUS) holds over 6,000 stocks from around the world according to market-cap weight. See my VXUS review for details.

I also keep to close to the world market-cap split with 50/50 US/non-US. If you want to go 70/30 or 60/40, that’s perfectly fine with me. Again it’s more important that you stick with it than any specific ratio.

Emerging Markets. Within the foreign markets, I choose to put extra money towards Emerging Markets – countries that currently include China, Taiwan, India, Brazil, South Africa, Mexico, Russia, Thailand, and Malaysia. Again, this asset class is more volatile but also has higher historical returns. The Vanguard FTSE Emerging Markets ETF (VWO) allows me to track this asset class in an efficient and low-cost manner. If there were better options for International Small Value stocks, I would have been open to that.

VXUS is 43% Developed Europe, 30% Developed Pacific, 19% Emerging Markets, and 7% Canada. My blend of 85% VXUS and 15% VWO is 37% Developed Europe, 26% Developed Asia, 31% Emerging Markets, and 6% Canada. Again, it’s not a huge tilt.

(Exit option: If something happened to me and my wife wanted to simultaneously simplify the portfolio, reduce the overall risk level, and generate cash, she could simply sell off my US Small Value and Emerging Markets positions that make up ~10% of the entire portfolio. The resulting portfolio would still be diversified.)

Real Estate. The Vanguard REIT ETF (VNQ) holds publicly-traded real estate investment trusts (REITs) which hold things like office buildings, hotels, apartment complexes, nursing homes, self-storage units, and shopping malls. I choose not to be active in residential real estate other than owning my own home, so I like the diversification and income that this asset class provides.

I am sticking with domestic REITs for both simplicity and lower costs. REITS only make up about 7% of my overall portfolio. I might include foreign REITS if it was a larger holding, but I’m going to bother splitting up 7%.

Bonds Breakdown

  • 50% High-quality, Intermediate-Term Bonds
  • 50% US Treasury Inflation-Protected Bonds

I keep roughly 30% of my portfolio in bonds. This is meant to be the stable ballast of my portfolio, but it should also generate some level of interest income. Bonds are debt, so I only lend money to the places that I think will pay me back most reliably:

  • US government, which can both tax residents and print the world’s reserve currency. This includes US Treasuries, FDIC-insured bank accounts, and US Savings bonds. Treasury Inflation-Protected bonds also offer an interest rate that adjusts with inflation.
  • Local municipalities, which can tax residents. If you don’t pay your property taxes, they take your house. “Muni bonds” currently offer the best tax-effective yield for my situation. I hold them through low-cost, actively-managed funds like Vanguard Intermediate-Term Tax-Exempt Fund Investor Shares (VWITX). See, I’m not only about index funds!

I exclude investment-grade corporate bonds because I don’t see enough benefit in taking on extra risk in this manner. I’d rather get 3% dividend yield through stock ownership (which includes unlimited upside potential) than get paid 3% interest (with no upside potential). Corporate bonds don’t have the company interests aligned with you – they want to appear stable and pay as little interest as possible. I’m not overly trusting of bond rating agencies in general.

I also exclude international bonds because what’s the point of diversifying to get a significantly lower interest rate? Vanguard US Total US Bond Market ETF (BND) has a current SEC yield of 2.43%. Vanguard Total International Bond ETF (BNDX) has a current SEC yield of 0.74%. Blech!

Recap. At a basic level, I own baskets of US businesses, international businesses, real estate, and high-quality debt. I plan to eventually spend the dividends from the businesses, rent from the real estate, and interest from the loans. I expect the stock dividends and rent to increase faster than inflation. I expect that the bond interest will at least keep up with inflation. This mix makes sense to me and I believe I can hold it through the ups and downs. It is not perfect but it is good enough.

The Growing Popularity of Index Funds and Higher Stock Valuations

bogleonmfI recently read (and re-read) a post at Philosophical Economics titled Diversification, Adaptation, and Stock Market Valuation, which serves both as an educational resource and an interesting argument for a new shift in stock investing. It’s rather lengthy and not written for novices, but it doesn’t require a finance or math degree either. I recommend reading it in full, but here are my notes.

#1 Diversification is good. Buying a single stock exposes you to the risk of your investment going to zero. Lots of companies have gone to zero. For a long-time, most people either bought individual stocks or bought funds that owned a limited number of individuals stocks. High risk leads to lower valuations and thus higher expected returns.

Buying a diversified basket of stocks provides good returns with greatly minimized risk of permanent capital loss. Here’s the dividend history of the S&P 500 from 1926-2016, adjusted for inflation:

indexrise2

#2 People are realizing that diversification is good. When Jack Bogle published Bogle on Mutual Funds in 1993, Vanguard was considered a big success after reaching $100 billion in assets. (I recently bought a first edition for my collection.) Today, Vanguard manages over $4 trillion in assets. Yes, 40 times as much.

In 2000, under 10% of asset were in index funds. Today, roughly 25% of the US stock market is now held in index funds with no signs of retreat. Nearly everyone has the ability to buy a basket of 500 to 3,000 stocks for just $5 a year per $10,000 invested.

indexrise

#3 We are also seeing higher average equity valuations. Correlation or causation? If everyone starts to agree that low-cost index funds (and “closet” index funds) makes investing less risky, then shouldn’t lower expected risk lead to higher valuations, and thus lower future expected returns? It won’t be a straight line, but it could be a powerful overall trend.

A couple of excerpts:

My argument here is that the ability to broadly diversify equity exposure in a cost-effective manner reduces the excess return that equities need to offer in order to be competitive with safer asset classes. In markets where such diversification is a ready option–for example, through low-cost indexing–valuations deserve to go higher. But that doesn’t mean that they actually will go higher.

To summarize: over time, markets have developed an improved understanding of the nature of long-term equity returns. They’ve evolved increasingly efficient mechanisms and methodologies through which to manage the inherent risks in equities. These improvements provide a basis for average equity valuations to increase, which is something that has clearly been happening.

Definitely food for thought.

Buy, Hold, Rebalance a Globally-Diversified Portfolio 2017

When I think about it, I am impressed with how different 2017 feels compared to when I started seriously learning about investing in 2003. Instead of only reading about it in few books mostly read by finance nerds, nowadays nearly every robo-advisor out there uses a globally-diversified mix of low-cost ETFs to build their portfolios. What used to be a relatively quiet alternative to buying 4-star active funds is now becoming the default choice.

We’ve seen from the Callan Investment Returns Table that the best-performing asset classes constantly change from year to year. In a industry magazine called Investments & Wealth Monitor, there was an article titled Why Global Asset Allocation Still Makes Sense by Anthony Davidow. (Found via AllAboutAlpha.)

Here’s an illustration of how a globally-diversified portfolio has outperformed. Below is a graphic from the article comparing a 100% S&P 500 portfolio, and 60/40 S&P 500/US Agg Bond portfolio, and a “globally diversified portfolio” using historical data from January 1, 2001 to December 31, 2016. Index values are used directly as opposed to actual ETFs or funds. The portfolio are rebalanced annually back to target asset allocation.

globaldiv

Their “diversified portfolio” had a rather finely-diced list of asset class ingredients:

  • 18% S&P 500 (US Large-Cap)
  • 10% Russell 2000 (US Small-Cap)
  • 3% S&P US REIT
  • 12% MSCI EAFE (International Developed)
  • 8% MSCI EAFE Small Cap
  • 8% MSCI Emerging Markets
  • 2% S&P Global Ex US REIT
  • 1% Barclays US Treasury
  • 1% Barclays Agency
  • 6% Barclays Securitized
  • 2% Barclays US Credit
  • 4% Barclays Global Agg EX USD
  • 9% Barclays VLI High Yield
  • 6% Barclays EM
  • 2% S&P GSCI Precious Metals
  • 1% S&P GSCI Energy
  • 1% S&P GSCI Industrial Metals
  • 1% S&P GSCI Agricultural
  • 5% Barclays US Treasury 3–7 Year

I do wish this portfolio was a bit more simple and easy to replicate. However, if you take a step back, you could simplify this asset allocation into the following:

  • 56% Global Stocks (50% US/50% Non-US)
  • 5% Global REIT (60% US/40% Non-US)
  • 34% Global Bonds (70% US/30% Non-US)
  • 5% Commodities

Now, we can’t necessarily expect a global portfolio to always outperform. One thing is usually doing better than another thing you own. Most recently, US stocks have outperformed International stocks quite significantly. Here’s an explanation from the article about the “free lunch” of diversification:

Diversification strategies do not guarantee capture of profits or protection against losses in any market environment, but they have been shown over time to provide a smoother ride. Rather than bearing the brunt of the 2000 Tech Wreck and the 2008 Great Recession, the diversified portfolio provided cushioning under the large market drop and was able recoup losses and grow over time.

Simple Portfolio Rebalancing Spreadsheet Template (Google Drive)

gsheetsUpdated. Automated portfolio management services like Wealthfront and Betterment will help you manage a diversified portfolio of low-cost index funds for a fee. While I understand their appeal for those that wish to outsource that task, I choose to maintain my own diversified portfolio of low-cost index funds. I enjoy having full control of all investment decisions, and I like saving the management fee (and adding that money to my snowball).

An important part of this DIY portfolio management is staying close to your target asset allocation. I use a very simple Google Spreadsheet to track my portfolio. Here is the direct link and it is also embedded below. Yellow cells are those meant to be edited.

(Download a free copy: I am sharing this spreadsheet online – free of charge – in read-only format. However, please make a copy of it using the menu option File > Make a copy or download it as an Excel file using option File > Download as). Any requests for edit access to the original public spreadsheet will be denied, because you would be changing the appearance for everyone.)


Here are some guidance on how to use the spreadsheet:

1. Decide on a target asset allocation. Don’t use the generic one I put above. There is no perfect portfolio. You can find plenty that look great based on history at this moment, but that will not be the perfect portfolio 5, 10, 25 years down the line. The best portfolio is the one that you can stick through even after your fanciest asset classes have negative returns for 5+ years.

Here are a few model portfolios to get you started. Below is what I have settled on for myself. Details here. You only have to enter this once as long as your target asset allocation stays the same.

2. Enter your total balances for each asset class. The easiest way to grab my holdings from multiple brokerage accounts is to use a aggregation service like Personal Capital (review). If you don’t have that many accounts, simply log into each individual website and add up your totals by asset class.

You could solely rely upon a service like Personal Capital to manage your portfolio, but I tend to use some specific asset classes like “US Small Value” or “Emerging Markets Value” which Personal Capital does not recognize. I do enjoy the fact that it pulls in all of my holdings and balances automatically into one screen and is always updated.

3. Check out the actual breakdown vs. your target breakdown. The spreadsheet shows the current actual percentage breakdown vs. your target breakdown, as well as the dollar amounts of any differences. A positive number means you need to buy more to reach your theoretical target (negative means sell). In the fictitious example shown, I might feel that I was close enough that I wouldn’t really bother with any rebalancing. If things were really off, I could buy/sell as needed.

3. Rebalance with new cashflow, dividends, and interest. Choose your frequency of “forced” rebalancing. By using this spreadsheet, you can see which asset classes should be invested in currently to bring you back towards your target asset allocation. This is where you should invest any new cashflow (i.e. paycheck, dividends, rental income, or interest that your portfolio generates).

In addition, you can rebalance by selling some asset classes and then buying another. I try not to sell too often as to avoid capital gains taxes. You can do this on a set calendar basis such as annually on your birthday or quarterly. Another method is to only rebalance once your percentages are off by a certain amount, like a tolerance band of +/- 5%. I personally check in quarterly to see where I should invest any new cashflows, and if things are really off then I rebalance by selling something at most once a year. If you have sizable taxable holding, you could also attempt some tax-loss harvesting during these check-ins.

Recap. If you are managing your own portfolio, it is important not to stray too far from your target asset allocation. In order to know where you should invest new funds, I track my portfolio in two ways. First, I use Personal Capital for a real-time, daily snapshot of my holdings. Second, I manually update this spreadsheet each quarter and print out a copy for my permanent, physical records. This takes about 15 minutes every 3 months. Using these two methods, I maintain complete control over my portfolio and I don’t have to pay any management fees to a robo-advisor.

Vanguard ETF vs. Mutual Fund Admiral Shares

Building My Portfolio BlocksAllan Roth has a new ETF.com article called Why ETFs Won’t Replace Mutual Funds. Inside, he offers the following reasons why if you are buying Vanguard funds, he typically recommends the Admiral Shares mutual fund over the ETF.

Vanguard Mutual fund advantages

  1. Can buy fractional shares
  2. No premium or discount—all transactions are at net asset value
  3. No spreads between bid and ask
  4. Less cash drag, as dividends are reinvested more quickly
  5. Can do a tax-free exchange from mutual funds to ETFs, but not the reverse
  6. Can do automated dollar cost averaging

In the interest of fairness, I will offer up the following:

Vanguard ETF advantages

  • Lower minimum investment amounts. Usually one share is only about $100, and some brokers even offer fractional shares.
  • No purchase or redemption fees. No short-term trading fee. Vanguard has these on a few mutual funds, for example the Vanguard Global ex-US Real Estate Fund Admiral Share charges a 0.25% fee on both purchases and redemptions.
  • You can easily hold, buy, trade Vanguard ETFs at any brokerage firm. The cost to trade will be as with any stock. (Vanguard mutual funds and ETFs trade free with a Vanguard brokerage account.) You might prefer the customer service of another firm, or you might prefer the convenience of having everything together if you hold non-Vanguard investments. You might already have free trades anyway, for example with the Robinhood app.

Expense ratio is a tie with Admiral Shares. I don’t know if it an official “written in stone” polcy, but Vanguard has a long history of keeping the expense ratios of ETFs and Admiral Shares mutual funds the exact same (mostly $10,000 minimum investment). The Investor Class usually has a slightly higher expense ratio (mostly $3,000 minimum).

Tax-efficiency is a tie. I will add in this reminder that in the case of Vanguard (and only Vanguard as far as I know), the ETF and mutual funds share the same underlying investments and thus the same level of tax-efficiency, utilizing the benefits of both where possible. From the Vanguard ETF FAQ:

Are there any tax advantages to owning a Vanguard ETF®?
Because Vanguard ETFs are shares of conventional Vanguard index funds, they can take full advantage of the tax-management strategies available to both conventional funds and ETFs.

Conventional index funds can offset taxable gains by selling securities that have declined in value at a loss. In addition, they tend to trade less frequently than actively managed funds, which means less taxable income gets passed on to shareholders. Vanguard ETFs can also use in-kind redemptions to remove stocks that have greatly increased in value (which trigger large capital gains) from their holdings.

My money. I hold most of my portfolio in Vanguard mutual funds (Admiral Shares). One reason is that I am old and have a good amount of capital gains in the mutual funds bought before ETFs gained traction. I also hold some Vanguard ETFs, mostly bought back when ETFs were cheaper because I didn’t have enough money to qualify for Admiral shares. (Prior to 2010, the minimum for Admiral funds was $100,000! These days the minimums are mostly a more reasonable $10,000.) These days, I don’t have a strong preference, but I slightly prefer the simplicity of buying mutual funds.

Vanguard ETF tool. If you really want to pick at the details, Vanguard offers their own ETF vs. mutual fund cost comparison calculator. It’s pretty good and even includes things like historical bid-ask spreads.

Bottom line. There are certainly differences between ETFs and mutual funds. It is worth comparing the advantages and disadvantages before making your decision. However, in terms of the big picture, we are talking about relatively small differences. Being low-cost, transparent, and diversified are more important features. Given that both have their relative advantages, both ETFs and mutual funds will be around for a long time.

How to Minimize Investment Returns – By Warren Buffett

brk2015At the bottom of the Berkshire Hathaway 2016 Annual Report, you may not have noticed that Warren Buffett republished a previous article from the 2005 annual report titled “How to Minimize Investment Returns”. A version become the first chapter (find it here) of The Little Book of Common Sense Investing by Jack Bogle. I am jumping on the bandwagon and republishing this 2007 blog post below as well. 🙂

It’s both a highly recommended parable and it comes at the perfect price of free. Read it if you haven’t already.

Original post:

I just watched the Will Smith movie The Pursuit of Happyness this weekend. I found it ironic that he really didn’t change job types when he joined Dean Witter. Mr. Gardner started out a salesman, and ended up a salesman. But by managing to change his product to financial services, he turned his tenacity and people skills into millions of dollars.

Why is financial services such a lucrative field? This reminded of an excerpt that I had saved from Warren Buffett’s 2005 Letter to the shareholders of Berkshire Hathaway. Although a tad on the long side, I think it provides an excellent “big picture” view of investing the the stock market.

[Read more…]