Search Results for: High Interest Savings

Acorns App Review: Auto-Invest Your Spare Change, Now Free For Students

acorns_screen

Updated review. New Android and web versions. Added details about “students invest for free” feature (anyone 24 and under). When I wrote about WiseBanyan, I remarked that now people could start investing a portfolio of ETFs with as little as 100 bucks. Well, what about investing just 57 cents at time?

Acorns is a new smartphone app that lets you invest your “spare change” into a diversified ETF portfolio of stocks and bonds. For example, if you bought something for $10.43, the Acorns app will “round up” your purchase to $11 and invest $0.57 into a brokerage account. The idea is that these small investments will make it simple and easy for folks to start saving and investing. Thanks to reader Steven for the tip.

How does it work? You’ll need to provide them:

  • Your personal information (name, address, SSN) because this is still a real SIPC-insured brokerage account underneath.
  • Your debit or credit card login information (so they can track your transactions and calculate round ups)
  • Your bank account and routing number (so they can pull money into your investment account)

The app scans your transactions, calculates the round-ups, pulls that money from your checking account, and automatically invests it for you. You can also make one-time deposits or schedule recurring deposits on a daily, weekly, or monthly basis. The app also tries to identify “found money” like rebates and rewards which it encourages you to also invest with a quick tap. Here’s a YouTube video demo:

Fees. You do not get charged any trading commissions for your investments, which can be a big factor in traditional brokerage accounts.

As of January 1st, 2015, Acorns has changed their fees to be either $1 a month (balances under $5,000) or 0.25% of assets per year (balances above $5,000). So on a $10,000 balance that would be $25 a year. No fee on $0 balances.

As of July 8, 2015, the management fees above will be waived for all students – defined as anyone under the age of 24 or you register under a .edu e-mail address and list your employment as “student”.

Withdrawals are free, but you may incur capital gains at income tax filing time. I don’t know if they will support asset transfers via ACAT.

Portfolio details. You can choose one of five target portfolios, ranging in risk level from conservative to aggressive. Mostly the popular Modern Portfolio Theory stuff that most other automated advisors offer… not surprising as their “Nobel Prize-winning economist advisor” is Harry Markowitz, who is a paid consultant.

acorns_portfolioma

All portfolios are constructed using the following six index ETFs:

  • Vanguard S&P 500 ETF (VOO)
  • Vanguard Small-Cap ETF (VB)
  • Vanguard FTSE Emerging Markets ETF (VWO)
  • Vanguard REIT ETF (VNQ)
  • PIMCO Investment Grade Corporate Bond ETF (CORP)
  • iShares 1-3 Year Treasury Bond ETF (SHY)

Fractional shares are used. Dividends are reinvested. Rebalancing happens automatically. Their asset allocation has much in common with most other automated portfolios, although it is probably one of the more different ones that I’ve seen in that you have no exposure to any stocks from Developed European and Asian countries like the UK, Japan, or Australia.

I’m a little concerned about all the tax lots created when buying stocks in such small amounts. Dealing with taxes when you sell might be a headache if they don’t import directly to TurboTax or similar tax software.

Availability. You can now use Acorns in either iOS/iPhone/iPad, Android, or online web-based application. The apps are also compatible with Apple Watch and Android Gear, for those so inclined.

My thoughts. My first reaction was… that it was a great idea that I wished I thought of first. I used to participate in Bank of America’s Keep The Change program, which is similar in that it also rounds up your BofA debit card transactions to the nearest dollar but instead moves the money into a BofA savings account paying essentially zero interest. Acorns takes it further by letting you use any bank and any debit or credit card, and also lets you invest it for potentially higher returns.

In addition, I agree that Acorns will lower the psychological barrier to investing because you don’t even have to commit to $25 a week or $500 a month. You know if you can afford a gizmo or meal at $15.66, you can afford it at $16, so why not invest that spare change? The hurdle can’t get much lower than that.

At the same time, we have to be realistic. With this model how much you save depends entirely on how many purchases you make, with a theoretical average of 50 cents saved per transaction. Even buying five things a day times 50 cents is $2.50 a day or $75 a month. It’s good as a kickstart, but not nearly enough to fund a retirement.

If you want to look at it purely mathematically, a monthly fee of $1 taken out of a $75 investment ends up being like a front-end load of 1.3%. Or given the target demographic of active smartphone users, you could just look at a buck a month as something you’d otherwise blow on some Candy Crush Saga app. I do think it is smart to let anyone 24 and under or a student use it for free.

Also, don’t call it a “piggy bank”. A piggy bank means you put in a quarter, and you can take out a quarter later on. A piggy bank is a bank savings account. Acorns on the other hand is a long-term investment account that you have to be ready not to touch for at least a decade. Sure the “expected” return is 4-9% but you have a good chance of a permanent loss of money if you withdraw within the next few years. If you start using this app, please remember this.

Bottom line: Neat idea, very nicely-designed app. Free for students or anyone age 24 and under. The Acorns app may not fund your entire retirement, but it can help those that need a nudge to invest. Automation helps you keep on track. I think there should an option for an FDIC-insured high-yield savings account.

Early Retirement Portfolio Income Update, Mid 2015

The closer I get to the reality of living off of my portfolio, the more I like the idea of living off dividend and interest income. However, you can’t just buy stocks with the highest dividend yields and junk bonds with the highest interest rates without giving up something in return. Certainly there are many bad investments lurking out there for desperate retirees looking for maximum income. My goal is to live off my portfolio income while not reaching too far for yield.

A quick and dirty way to see how much income (dividends and interest) your portfolio is generating is to take the “TTM Yield” or “12 Mo. Yield” from Morningstar quote pages. Trailing 12 Month Yield is the sum of a fund’s total trailing 12-month interest and dividend payments divided by the last month’s ending share price (NAV) plus any capital gains distributed over the same period. SEC yield is another alternative, but I like TTM because it is based on actual distributions (SEC vs. TTM yield article).

Below is a close approximation of my most recent portfolio update. I have changed my asset allocation slightly to 60% stocks and 40% bonds because I believe that will be my permanent allocation upon early retirement.

Asset Class / Fund % of Portfolio Trailing 12-Month Yield (6/24/15) Yield Contribution
US Total Stock
Vanguard Total Stock Market Fund (VTI, VTSAX)
24% 1.79% 0.42%
US Small Value
WisdomTree SmallCap Dividend ETF (DES)
3% 2.78% 0.08%
International Total Stock
Vanguard Total International Stock Market Fund (VXUS, VTIAX)
24% 2.75% 0.81%
Emerging Markets Small Value
WisdomTree Emerging Markets SmallCap Dividend ETF (DGS)
3% 2.81% 0.09%
US Real Estate
Vanguard REIT Index Fund (VNQ, VGSLX)
6% 3.76% 0.22%
Intermediate-Term High Quality Bonds
Vanguard Limited-Term Tax-Exempt Fund (VMLUX)
20% 1.63% 0.34%
Inflation-Linked Treasury Bonds
Vanguard Inflation-Protected Securities Fund (VAIPX)
20% 2.18% 0.45%
Totals 100% 2.24%


The total weighted 12-month yield was 2.24%. This number is lower than the last three updates: 2.41%, 2.49%, and 2.31%. This means that if I had a $1,000,000 portfolio balance today, it would have generated $22,400 in interest and dividends over the last 12 months. Now, 2.24% is significantly lower than the 4% withdrawal rate often recommended for 65-year-old retirees with 30-year spending horizons, and is also lower than the 3% withdrawal that I prefer as a rough benchmark for early retirement. I should note that the muni bond interest in my portfolio is exempt from federal income taxes.

As noted previously, a simple benchmark for this portfolio is Vanguard LifeStrategy Growth Fund (VASGX) which is an all-in-one fund that is also 60% stocks and 40% bonds. That fund has a trailing 12-month yield of 2.01%. (Last update, it was 2.09%.)

So how am I doing? Using the 2.24% income yield, the combination of ongoing savings and recent market gains have us at 72% of the way to matching our annual household spending target. If I switch to a 3% benchmark, we are 96% there. Consider that if all your portfolio did was keep up with inflation each year (0% real returns), you could still spend 2% a year for 50 years. From that perspective, a 2% spending rate seems like a very conservative lower bound.

Sadly, some valuation models predict exactly that: 0% real returns over a long time. My portfolio has certainly gone up a ton in value due to the ongoing bull market. Bottom line is that we are getting closer but not quite where we want to be.

Early Retirement Portfolio Asset Allocation Update, Mid 2015

Here’s a mid-year update on my investment portfolio holdings for 2015. This includes tax-deferred accounts like 401(k)s and taxable brokerage holdings, but excludes things like physical property and cash reserves (emergency fund). The purpose of this portfolio is to create enough income to cover all of our household expenses.

Target Asset Allocation

aa_updated2015

I try to pick asset classes that will provide long-term returns above inflation, distribute income via dividends and interest, and finally offer some historical tendencies to balance each other out. I don’t hold commodities futures or gold as they don’t provide any income and I don’t believe they’ll outpace inflation significantly. In addition, I am not confident in them enough to know that I will hold them through an extended period of underperformance (i.e. don’t buy what you don’t can’t stick with).

Our current ratio is roughly 70% stocks and 30% bonds within our investment strategy of buy, hold, and rebalance. With a self-directed portfolio of low-cost funds and low turnover, we minimize management fees, commissions, and taxes.

Actual Asset Allocation and Holdings

1506aa

Stock Holdings
Vanguard Total Stock Market Fund (VTI, VTSMX, VTSAX)
Vanguard Total International Stock Market Fund (VXUS, VGTSX, VTIAX)
WisdomTree SmallCap Dividend ETF (DES)
WisdomTree Emerging Markets SmallCap Dividend ETF (DGS)
Vanguard REIT Index Fund (VNQ, VGSIX, VGSLX)

Bond Holdings
Vanguard Limited-Term Tax-Exempt Fund (VMLTX, VMLUX)
Vanguard Intermediate-Term Tax-Exempt Fund (VWITX, VWIUX)
Vanguard High-Yield Tax-Exempt Fund (VWAHX, VWALX)
Vanguard Inflation-Protected Securities Fund (VIPSX, VAIPX)
iShares Barclays TIPS Bond ETF (TIP)
Individual TIPS securities
U.S. Savings Bonds (Series I)

Notes and Benchmark Comparison

There has been very little portfolio activity over the last 6 months. No major market movements (the S&P 500 hasn’t moved more than 2% in day so far in 2015). No mutual funds added or removed. I continued to invest in the same funds through 401k auto-contributions and the occasional fund purchase from saved income. Things are little off, but I’ll just wait and rebalance with new money. Some of my usual savings has been diverted to college savings. Mostly, just keeping my head down and moving forward. 🙂

A simple benchmark for my portfolio is 50% Vanguard LifeStrategy Growth Fund (VASGX) and Vanguard LifeStrategy Moderate Growth Fund (VSMGX), one is 60/40 and one is 80/20 so it also works out to 70% stocks and 30% bonds. That benchmark would have returned about 3.5% YTD for 2015. I haven’t bothered to calculate my exact portfolio return, but it should be roughly around this number.

I like tracking my dividend and interest income more than overall market movements. In a separate post, I will update the amount of income that I am deriving from this portfolio along with how that compares to my expenses.

Teaching Money Management Skills… Without Using Money

valuesandmoney

spoiled160In the book The Opposite of Spoiled by Ron Lieber, there are a number of tips and tricks presented to help teach your kids to be good with money:

The foundation of the book is a detailed blueprint for the most successful ways to handle the basics: the tooth fairy, allowance, chores, charity, saving, birthdays, holidays, cell phones, checking accounts, clothing, cars, part-time jobs, and college.

As I read through them, most of them were never found in my own childhood. I was never given a wad of money to buy my own school clothes. I didn’t have a fancy save/spend/give jar system. I had chores, but was never paid for them. There was no forced or guided philanthropy. My parents didn’t pay me interest on my savings. When confronted with the fact that all my friends had allowances, my parents eventually relented and gave me… a dollar a week. This was sometime in high school.

I’m not saying that all these clever little schemes don’t help to create financial skills. I plan to use some of them myself. But we should also focus on the core values and character traits that lead to good behavior in general. Indeed, this is also acknowledged in the book:

Finally, I want to help all of you recognize that every conversation about money is also about values. Allowance is also about patience. Giving is about generosity. Work is about perseverance. Negotiating their wants and needs and the difference between the two has a lot to do with thrift and prudence.

So I took many of the topics in the book and tried to connect them with the corresponding character traits in the big graphic shown above.

There are many other ways to encourage your kids to learn traits like patience, perseverance, curiosity, or delayed gratification. Many have been part of cultures and/or religions for centuries. The first way kids learn is by watching their parents, so we must be good examples as well. (I know, can’t I just buy an app or something instead? I mean, thanks Mom and Dad!)

Annual Income by College Major Ranked by Quartile and Percentile

Here’s another article about the relationship between college majors and future earnings. But this WSJ article at least looks beyond just providing the median wage and helps you visualize the spread between the 25th and 75th percentiles for each major:

wsjcollegerank

There is also an interactive chart embedded in the WSJ article. For example, I could sort to find the top 10 majors according to their 25th percentile wage, imagining more of a worst-case scenario that just assuming I’ll get the median income or higher. Here are a few more nuggets that may surprise you:

Graduates of architecture programs may have higher salaries than teachers, as the latest paper shows, but the February report noted that they’re also likely to see unemployment rates twice those of education majors.

[…] just choosing a major in science, technology, engineering or mathematics, known as the STEM fields, doesn’t secure a hefty paycheck. Mr. Carnevale’s team found that biology majors have median annual wages of $56,000 over their careers from age 25 to 59, or about one-third less than physicists.

Yet once biologists finish graduate programs—and more than half of them do—their median annual earnings jump to $96,000, roughly on par with physicists who have advanced degrees.

There are also wide ranges in salaries for specific majors. The top 25% of earners who majored in finance can expect annual earnings of more than $100,000, while the bottom quartile may bring in just about $50,000 a year.

[…] lifetime earnings for economics majors at the 90th percentile are nearly triple those at the 10th, reflecting the range of destinations for such experts in government and the private sector.

I support the notion that prospective income shouldn’t be the only consideration in choosing a career, as I’ve tried working in decent-paying fields that don’t interest me and it just didn’t work out. However, money remains a factor and I like to have an idea of what the stats are.

Here’s another thing to consider: early retirement in under 20 years requires a 50% savings rate. Such a savings ratio is much more likely if you make twice the overall median salary with median spending (make $120k household income, spend $60k) as opposed to a median salary and half-of-median spending (make $60k household, spend $30k). Someone could start working at 21, retire by 40, and spend the rest of their life doing whatever job or activity they wanted to. Semi-retirement is another option.

Paperless vs. Paper Statements

scansnap

Pictured above is the Fujitsu ScanSnap iX500 Scanner. It can digitize a page every 2 seconds, and some version of it has been on my Amazon Wishlist for many years. However, I still haven’t plunked down 400 bucks for it, because I don’t know if I’ll ever go completely paperless.

There are many tutorials on how to scan all your paper documents into Dropbox or Evernote. Liz Weston recently had a Reuters article about going paperless with tax-related documents:

I don’t make New Year’s resolutions. Instead, I resolve every tax season to get a better handle on my paperwork — with mixed results. This year, I turned to three certified public accountants to find out what apps, software and strategies they use to keep track of everything.

Kelley Long, a Chicago CPA and personal financial specialist, tries to generate as little paperwork as possible, opting for electronic records instead. “The IRS accepts electronic records,” said Long, resident financial adviser with Financial Finesse in Chicago. “There’s no need to keep paper. That’s the one thing they’re modern about.”

Long keeps a folder on her computer desktop for the current year’s tax documents. If a document comes to her in paper form, she scans it, saves it in the folder and shreds the original. She converts emails documenting charitable contributions and other tax-related expenses into PDF files by choosing the “print” function and then “save as PDF.” […] At the end of the year, she downloads her bank and credit card statements into the folder.

But then Reader Bill sent over this Clark Howard article about the benefits of paper statements:

If you think about all the companies you do business with, they all try to get you to turn off paper statements. If you’ve done so, I want you to turn that around and go back to getting statements in the mail.

With a paper statement in hand, it’s easier to prove that you had the money in the first place in the event funds go missing. If you are set up for electronic info only, well, that’s going to hurt. So the best precaution I can give is for you to go back to getting the paper.

So, which is safer? In my opinion, for most things they are equivalent. Paper statements can be lost, stolen, or destroyed (i.e. house fire). Electronic statements can be lost, hacked, or destroyed (i.e. hard drive crash). You can protect yourself with redundant copies of either one (i.e. safe deposit box, extra USB drive, cloud backup). Keeping a nice long history of either paper or paperless statement can help you prove ownership or status of assets. Indeed, the IRS accepts electronic copies as equivalent to paper, so why shouldn’t we?

(I would agree with the implication that those repeated calls for you to “go paperless” are less about eco-friendliness and more about saving printing and mailing costs. I am also curious to know if credit card companies have found that paperless statements lead to more missed payments and thus more interest and late fees. It certainly is less wasteful, though.)

The safest thing would be to keep both. In the event of some Fight Club-esque event where the digital records of your assets are lost, paper statements might help. In the event of some local disaster where my home and my bank is destroyed, then digital records in the cloud would be helpful. (It may be a good idea to read up on file encryption.)

What do I do? I maintain regular paper statements for my most important financial accounts. That’s basically my primary IRA, 401(k), brokerage, checking, and savings accounts. The main reason for the statements is that I am in charge of family finances, and if I am injured or worse, then my spouse will be able to track everything simply by opening up the mail (plus other estate documents). I also keep paper copies of our monthly bills coming in for the same reason. I still enjoy my ritual of sitting down with physical bills and paying my bills (online) once a month as I use the opportunity to review our monthly spending. Important statements are sent to a P.O. Box instead of my house to reduce chance of theft and protect privacy.

I also have several other financial accounts that are either dormant, temporarily opened for reviews or experiments, or have low balances. Those are all set to paperless and tracked online by Mint.com. I’d rather give Mint my passwords and keep a virtual eye on all of them, rather than the likely alternative of never checking in on them at all.

Charlie Munger On Leverage and Paying Your Mortgage Off Before Retirement

housemoneyWhile reading back through various transcript notes from the 2015 Berkshire Hathaway Annual Meeting, I recalled the following quote from the Q&A session. A shareholder had asked why Berkshire had never borrowed money to buy stocks (i.e. leverage). Charlie Munger replied:

It’s obviously true. If we’d used the leverage that some others did, Berkshire would have been much bigger … but we would have been sweating at night. And it’s crazy to sweat at night.

This is an important point, as many other similar investors have used leverage to boost their returns (not always, but some with success). Buffett and Munger certainly could have justified such an action, especially given their excellent investment track record.

Munger did not make this jump, but I believe but an individual investor could also apply this quote to paying off their mortgage early. Even I enjoy discussing the details of mortgage payoff vs. retirement savings, and acknowledge that mortgage interest rates are low while stock returns are historically higher. Why use your money to pay off your mortgage when you could invest in stocks instead?

The problem is that if you are putting off paying off your mortgage just so you can invest in stocks, you are using leverage! That is, you are taking borrowed money and then putting it at risk. That may increase your overall returns, but it will also increase your exposure to bad outcomes. For most people – not everyone, but most – paying off your mortgage debt will help you sleep better at night. Based on his biography, Warren Buffett himself bought a house in cash when he got married. Even though he was confident he would have made more money by putting those funds toward his investment partnership, he chose not to have a mortgage.

In addition, many financial advisors are incentivized to maximize the amount of your money that they manage, as they can’t earn any fees off your home equity. Wes Moss, a fee-only advisor and Money Matters radio show host, ignores that and gives blunt advice in his book You Can Retire Sooner Than You Think:

Sooner or later, every homeowner asks the simple question, “Should I pay off my mortgage?” and immediately gets bombarded with a variety of complicated, hedged responses. Here is the simplest possible answer: Yes. If you are anywhere near retirement and can afford to pay off your mortgage, you should.

I view this as an example of how real-world, experience-based advice can differ from theoretical, academic-based advice. Humans are not perfectly rational. I have never regretted paying off my mortgage early, although I do agree with the qualification that mortgage payoff should roughly coincide with retirement date.

* Of course, Warren Buffett quickly added: “…over financial things.” Ba-dum-bum-ching!

AT&T Access More MasterCard from Citi Review – GSM Phone Offer (Up to $650)

accessmore180Our partner Citi has launched yet another new card, AT&T Access More MasterCard® from Citi. This AT&T co-branded card obviously targets a niche, but read on if you will be in the market for a new GSM phone in the next year ($650 is the full price of a new iPhone 6). As such, this card took a little extra research and analysis. Be sure to read all the details before applying, so you understand how to get everything possible out of this offer.

“Exclusive New Phone Offer” details. Yes, the offer screams “new phone”! But lots of ads say that. What kind of new phone? Does it include iPhone 6 or Samsung Galaxy S6? What strings are attached? Do I need to sign a contract?

  • You must spend $2,000 in purchases with your AT&T Access More Card within 3 months of account opening. As with other sign-up bonuses, this is the spending hurdle. The application page also says “If you buy a new phone now it will count toward the $2,000 in qualifying purchases!”. At first, I read this to mean “buy a phone and you don’t need to spend $2,000 anymore”. Nope. It’s just reminding you that if, for example, you buy a $650 phone on this card, then you’ll only need to spend another $1,350 on the card to meet the $2,000 threshold.
  • You can get any new phone on the AT&T website. Apple iPhone 6, iPhone 6 Plus, Samsung S6, Samsung S6 Edge, flip phone, whatever.
  • They’ll give you up to $650 back towards a new phone bought full price with no annual contract… At first this may seem like a negative, man I have to buy it at full price? But that’s actually a good thing when the credit is for up to $650! For example, an iPhone 6 starts at $649.99 and Samsung S6 starts at $684.99. (Taxes, shipping, fees, and wireless service not included.)
  • … which also means lower monthly bills! When you essentially bring your own device (BYOD) buy buying the phone outright, AT&T will give you lower bills in the form of $15 to $25 off each month on their Mobile Share Value plans. Also, the $40 per-line activation fee is waived when you buy the phone at full price (and is not waived for 2-year contracts). More details on this below.
  • Since you own the phone and are not on a contract, you can also unlock it for use on any carrier. You can find unlock instructions at att.com/deviceunlock. are the AT&T unlock instructions [pdf]. Postpaid customers have an active account for at least 60 days, with no past due or unpaid balance. Non-AT&T customers can request a phone unlock before activating the phone on an AT&T plan. After submitting your request, the unlock should be done within 48 hours.
  • You must buy the phone using their special link. After you buy the phone, then activate it on an AT&T monthly plans of you choice for at least 15 days. Remember, you’re not bound to a contract after that. It’s easier just to quote from their Terms and Conditions:

    You must purchase an eligible phone from AT&T with your AT&T Access More Credit Card from Citi (the “Card”) using the Phone Offer Link created individually for you. This link may be accessible to you in several locations including, but not limited to, your approval screen at the time you apply, an email welcoming you to Access More Card membership (if you provide a valid email address) and through your Online Account at citi.com/att. You may redeem the Phone Offer using the link at any time after your Card account opening. Once you have made $2,000 in purchases within the first 3 months of your Card account opening, and purchased and activated your eligible phone, Citi will credit your account for the cost of the eligible phone you purchased up to $650 (exclusive of taxes, fees, shipping and wireless service) within 1 to 2 billing cycles. If you choose to purchase an eligible phone which costs more or less than $650, your credit will equal the cost of the phone or $650, whichever is less.

Side question: How does paying full price for a phone compare with the subsidized 2-year contract or the AT&T Next plan? Most people don’t pay full price for a phone. It’s a lot of money. AT&T Next is basically like agreeing to pay full price for a phone but they let you pay in monthly installments instead. So the $650 iPhone 6 would $21.67 for 30 months (multiply that out and you get $650.10.) Nothing really special there. The traditional alternative is that you get a subsidized phone but you enter a 2-year contract at a higher monthly bill. Here’s how the two options compare:

  • The phone subsidy with a 2-year contract is $450, but you have a $40 activation fee. So the $650 iPhone 6 would only cost $200, plus a $40 per-line activation fee.
  • The monthly bill subsidy with a full price phone adds up to either $360 or $640 over 2 years. With the full price phone, there is no activation fee. If your Mobile Share Value plan comes with 6GB of data or less, you get a $15 discount per month per line. $15 times 24 months = $360. If your Mobile Share Value plan comes with 10GB or more, you get a $25 discount per month per line. $25 times 24 months = $600.

So if you compare the savings between the full price plan as 2-year contract, you’re either behind by $50 over two years, or ahead by $190 over two years. So worst case you’re behind by $50 at the 2-year mark, but if you kept your full price phone and cheaper-by-$15 plan for just an extra 4 months past the contract end date, you’d be ahead again.

Ongoing card rewards program highlights. This card also has a unique rewards program using Citi ThankYou points:

  • 3 ThankYou Points for every $1 you spend on purchases made online at retail and travel websites*
  • 3 ThankYou Points for every $1 you spend on products and services purchased directly from AT&T*
  • 1 point earned for every $1 you spend on other purchases*
  • 10,000 Anniversary bonus points after you spend $10,000 in prior cardmembership year*
  • $95 annual fee.

Here are snippets from the fine print that I think are helpful:

Retail websites are websites that sell goods directly to the consumer through an online website and include department store websites, specialty store websites, warehouse store websites and boutique websites. Travel websites are websites that allow you to book travel and include online travel agencies, hotel websites and airline websites.

AT&T purchases are AT&T consumer products and/or services purchased directly from AT&T. AT&T consumer products and services must be purchased from www.att.com, www.telephones.att.com, AT&T owned stores or AT&T customer service centers. Purchases from independent wireless dealers or AT&T resellers are not eligible, unless they are for payment of AT&T service.

That means you can get 3 ThankYou points per $1 of purchases at Amazon.com, Costco.com, Apple.com, Walmart.com, Target.com, Expedia.com, and so on as well at your AT&T monthly service bill. Please see my Citi ThankYou Premier card review for details on redeeming your ThankYou points for at least $100 value per 10,000 points, but note that the special 25% bonus on travel redemption only apply if you also hold the ThankYou Premier card (you can redeem points earned from this card). Throw in the even-more special American Airlines flight awards from the Citi Prestige card and those 3X ThankYou categories start looking even better.

Bottom line. This is a niche card for folks that will soon be in the market for a new GSM phone, especially AT&T customers. (Non-AT&T customers can request a phone unlock before activating the phone on an AT&T plan, after which you’ll have an unlocked GSM phone that can be used on another GSM carrier. Afterward, you’ll still need to activate an AT&T plan for 15 days to get the credit.) If that’s you, then the sign-up bonus is very generous – up to $650 towards a full-price, no-contract AT&T GSM phone. Looking at all the scenarios above, even in the worst case you’d be behind $50 after two years vs. buying new AT&T phone via 2-year contract. There is also the $95 annual fee. That’s still a net benefit of over $500 and thus one of the top credit card sign-up bonuses currently available. The card then offers you ongoing bonus rewards on AT&T service as well as an interestingly broad category of “retail websites”. However, that $95 annual fee is rather high unless you spend $10,000 annually on the card and get the 10,000 ThankYou point anniversary bonus to offset it.

“Disclaimer: This content is not provided or commissioned by the issuer. Opinions expressed here are author’s alone, not those of the issuer, and have not been reviewed, approved or otherwise endorsed by the issuer. This site may be compensated through the issuer’s Affiliate Program.”

Prosper vs. LendingClub Investor Experiment: 2.5 Year Update

lcvspr_clipo
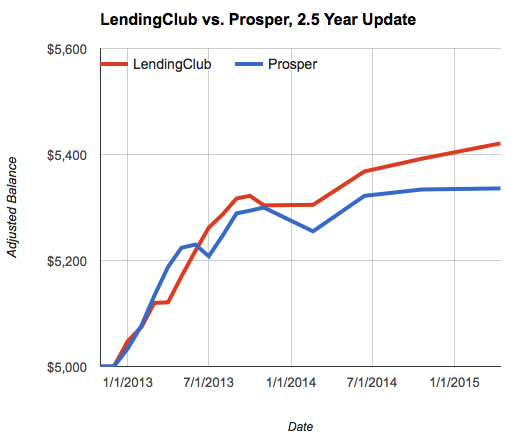
In November 2012, I invested $10,000 into person-to-person loans split evenly between Prosper Lending and Lending Club, both out of curiosity and for a chance at higher returns from a new asset class. After diligently reinvesting my earned interest into new loans, I stopped my after one year (see previous updates here) and started just collecting the interest and waiting see how my final numbers would turn out at the end of the 3-year terms.

My last update was 6 months ago, so here’s what things look like after roughly two and a half years. This will be my last update before final liquidation of my portfolio (see recap below).

$5,000 LendingClub Portfolio. As of April 14, 2015, the LendingClub portfolio had 129 current and active loans remaining with a principal value of $1,003 (1 in grace period). 96 loans were paid off early and 29 were charged-off . 1 loan is between 31-120 days late and 2 are in default, which I will assume to be unrecoverable ($37.07 in principal). $417.94 in uninvested cash is left in the account, and I also withdrew $4,000 previously (payments and interest). Total adjusted balance is $5,421.

1504_lc2

$5,000 Prosper Portfolio. My Prosper portfolio now has 110 current and active loans with a principal value of $1,404. 114 loans were paid off early, 42 charged-off. 1 loans are between 1-30 days late ($22). 3 are over 30 days late, which I am going to write off completely (~$18). $410.26 in uninvested cash is left in the account, and I also withdrew $3,500 previously (payments and interest). Total adjusted balance is $5,336.

1504_prosper1

Experiment Recap and Conclusions

  • P2P lending has successfully gone mainstream. The fact that institutional investors are buying a significant portion of Prosper and LendingClub loan inventory would seem to prove that the concept is viable. This WSJ article says 66% of Prosper loans in 2014 had been sold to institutional investors. What started out as the Wild West of unsecured loans is now accepted by Wall Street. LendingClub had a successful IPO in December 2014 (which they generously let their lenders participate in).
  • LendingClub reports my adjusted* annualized returns as 4.30% annualized. Prosper reports my annualized returns as 4.10% annualized. These returns are certainly above that of a savings account or bank CD, but not as good as many other asset classes over the same period. Considering the weighted average interest rate on those loans was 12% for LendingClub and 14% on Prosper, I saw a lot of defaults. (*Adjusted means you assume all loans 30+ days late will be total losses.)
  • My reported returns consistently deteriorated as my loans aged. 10 months ago Prosper said my returns were 5.76%. 14 months ago Prosper said my returns were 7.55%. LendingClub reported my unadjusted annualized return 6 months ago as as 5.27%. 10 months ago, it was 5.94%. The lesson here is that your returns will continue to vary and likely deteriorate as your loans age, so don’t assume your returns will always stay the same as they are in the beginning. Also, your returns will look higher if you keep reinvesting into new loans.
  • I am not a good loan picker. But will you be better? My returns are below average when compared to the advertised historical numbers. Certainly, I have seen reported numbers from other people who have done much better. Who knows, you may be the next P2P Bond King! 🙂 But I took my shot, diversified into over 400 loans, and here are my honest results. Not everyone who gets bad returns is willing to share about them.
  • For small-time individual investors, dealing with unfamiliar forms at tax time can be tedious and time-consuming. Dealing with the tax forms each year isn’t impossible, but it isn’t fun either. If I were to invest all over again, I would definitely do it within an IRA to avoid tax headaches. To save more time, I would also buy at least 100 loans x $25, which also happens to be the $2,500 minimum for free auto-investment at LendingClub (no minimum at Prosper).
  • I plan on liquidating the rest of my portfolio by the end of 2015. In June 2014, I still had $5,493 of principal in active loans in both LendingClub and Prosper. (The rest was idle cash, mostly withdrawn.) Now, roughly 10 months later, I only have $2,407 in principal and my total balance grew by a measly $67. $67 dollars! After filing my 2014 tax returns, I decided it was not worth the headache of dealing with the 1099s involved with these little loans. Thus, I plan on selling my remaining notes on the secondary market, probably soon but definitely by year-end. I might try again in the future inside an IRA, but for now I choose simplicity.
  • LendingClub vs. Prosper relative performance. I tried my best to invest at both websites with the same criteria and overall risk preference. As noted, my LendingClub reported returns (4.3%) are a bit higher than my Prosper reported returns (4.1%). This is also supported by my own balance updates, although I wouldn’t put too much importance on the absolute numbers as I stopped reinvesting into new loans after the first year. Here’s an updated chart:1504_lcprosper

Early Retirement Portfolio Income Update, Year-End 2014

When investing, should you focus on income or total return? I like the idea of living off dividend and interest income, but I also think it is easy for people to reach too far for yield and hurt their overall returns. But what is too far? That’s the hard part. Certainly there are many bad investments lurking out there for desperate retirees looking for maximum income. If possible, I’d like to invest for total return and then live off the income.

A quick and dirty way to see how much income (dividends and interest) your portfolio is generating is to take the “TTM Yield” or “12 Mo. Yield” from Morningstar quote pages. Trailing 12 Month Yield is the sum of a fund’s total trailing 12-month interest and dividend payments divided by the last month’s ending share price (NAV) plus any capital gains distributed over the same period. SEC yield is another alternative, but I like TTM because it is based on actual distributions (SEC vs. TTM yield article).

Below is a close approximation of my most recent portfolio update. I have changed my asset allocation slightly to 60% stocks and 40% bonds because I believe that will be my permanent allocation upon early retirement.

Asset Class / Fund % of Portfolio Trailing 12-Month Yield (1/5/14) Yield Contribution
US Total Stock
Vanguard Total Stock Market Fund (VTI, VTSAX)
24% 1.76% 0.42%
US Small Value
WisdomTree SmallCap Dividend ETF (DES)
3% 2.68% 0.08%
International Total Stock
Vanguard Total International Stock Market Fund (VXUS, VTIAX)
24% 3.4% 0.81%
Emerging Markets Small Value
WisdomTree Emerging Markets SmallCap Dividend ETF (DGS)
3% 3.17% 0.09%
US Real Estate
Vanguard REIT Index Fund (VNQ, VGSLX)
6% 3.60% 0.22%
Intermediate-Term High Quality Bonds
Vanguard Limited-Term Tax-Exempt Fund (VMLUX)
20% 1.68% 0.34%
Inflation-Linked Treasury Bonds
Vanguard Inflation-Protected Securities Fund (VAIPX)
20% 2.24% 0.45%
Totals 100% 2.41%


The total weighted 12-month yield was 2.41%, as opposed to 2.49% and 2.31% the previous two quarters. This means that if I had a $1,000,000 portfolio balance today, it would have generated $24,100 in interest and dividends over the last 12 months. Now, 2.41% is significantly lower than the 4% withdrawal rate often recommended for 65-year-old retirees with 30-year spending horizons, and is also lower than the 3% withdrawal that I prefer as a rough benchmark for early retirement. But in theory the total return will be much greater due to share appreciation.

As noted previously, a simple benchmark for this portfolio is Vanguard LifeStrategy Growth Fund (VASGX) which is an all-in-one fund that is also 60% stocks and 40% bonds. That fund has a trailing 12-month yield of 2.09%. Keep in mind that the muni bond interest in my portfolio is exempt from federal income taxes.

So how am I doing? Using my 3% benchmark, the combination of ongoing savings and recent market gains have us at 91% of the way to matching our annual household spending target. Using the 2.41% number, I am only 73% of the way there. Consider that if all your portfolio did was keep up with inflation each year (0% real returns), you could still spend 2% a year for 50 years. From that perspective, a 2% spending rate seems like a very conservative lower bound.

Early Retirement Portfolio Asset Allocation Update, Year-End 2014

Here’s a final update on my investment portfolio holdings for 2014. This includes tax-deferred accounts like 401(k)s and taxable brokerage holdings, but excludes things like physical property and cash reserves (emergency fund). The purpose of this portfolio is to create enough income to cover all of our household expenses.

Target Asset Allocation

aa_updated2015

I try to pick asset classes that will provide long-term returns above inflation, distribute income via dividends and interest, and finally offer some historical tendencies to balance each other out. I don’t hold commodities futures or gold as they don’t provide any income and I don’t believe they’ll outpace inflation significantly. In addition, I am not confident in them enough to know that I will hold them through an extended period of underperformance (i.e. don’t buy what you don’t understand).

Our current ratio is roughly 70% stocks and 30% bonds within our investment strategy of buy, hold, and rebalance. With a self-directed portfolio of low-cost funds and low turnover, we minimize management fees, commissions, and taxes.

Actual Asset Allocation and Holdings

aa_pie_2014final

Stock Holdings
Vanguard Total Stock Market Fund (VTI, VTSMX, VTSAX)
Vanguard Total International Stock Market Fund (VXUS, VGTSX, VTIAX)
WisdomTree SmallCap Dividend ETF (DES)
WisdomTree Emerging Markets SmallCap Dividend ETF (DGS)
Vanguard REIT Index Fund (VNQ, VGSIX, VGSLX)

Bond Holdings
Vanguard Limited-Term Tax-Exempt Fund (VMLTX, VMLUX)
Vanguard Intermediate-Term Tax-Exempt Fund (VWITX, VWIUX)
Vanguard High-Yield Tax-Exempt Fund (VWAHX, VWALX)
Vanguard Inflation-Protected Securities Fund (VIPSX, VAIPX)
iShares Barclays TIPS Bond ETF (TIP)
Individual TIPS securities
U.S. Savings Bonds (Series I)

Notes and Benchmark Comparison

There was very little activity during the last quarter of 2014. I’ll need to do some rebalancing in the beginning of 2015. I did change my asset allocation tree above to reflect that my bond holdings have a weighted duration of close to 4 years now. It used to say “shorter-term” but really now it is more “intermediate-term”. I’ve been putting my new bond money into VWIUX, which holds intermediate-term high-quality municipal bonds. I haven’t sold any of my limited-term holdings. Overall, it’s a little longer in maturity and a little higher yield, but nothing drastic. I don’t really listen to future rate predictions; they’ve been wrong more than they’ve been right.

I’ve already noted the 2014 performance of each individual fund here along with my overall portfolio total return of roughly 6.5% for 2014.

A simple benchmark for my portfolio is 50% Vanguard LifeStrategy Growth Fund (VASGX) and Vanguard LifeStrategy Moderate Growth Fund (VSMGX), one is 60/40 and one is 80/20 so it also works out to 70% stocks and 30% bonds. That would have returned about 7.1% for 2014. One reason for my portfolio’s relative underperformance to this benchmark is my inclusions of TIPS bonds which returned 3.5% whereas the Vanguard Total International Bond Index Fund (BND) returned 6% for the year. I’m still happy to hold TIPS. If I had more tax-advantaged space and/or a lower tax rate I’d hold BND instead of muni bonds but I’m still happy with my muni funds as well.

In a separate post, I will update the amount of income that I am deriving from this portfolio along with how that compares to my expenses.

Early Retirement Portfolio Income Update – October 2014

When investing, should you focus on income, or total return? I like the idea of living off dividend and interest income, but I also think it is easy for people to reach too far for yield and hurt their overall returns. But what is too far? That’s the hard part. Certainly there are many bad investments lurking out there for desperate retirees looking for maximum income. If possible, I’d like to invest for total return and then live off the income.

A quick and dirty way to see how much income (dividends and interest) your portfolio is generating is to take the “TTM Yield” or “12 Mo. Yield” from Morningstar quote pages. Trailing 12 Month Yield is the sum of a fund’s total trailing 12-month interest and dividend payments divided by the last month’s ending share price (NAV) plus any capital gains distributed over the same period. SEC yield is another alternative, but I like TTM because it is based on actual distributions (SEC vs. TTM yield article).

Below is a close approximation of my most recent portfolio update. I have changed my asset allocation slightly to 60% stocks and 40% bonds because I believe that will be my permanent allocation upon early retirement.

Asset Class / Fund % of Portfolio Trailing 12-Month Yield (10/18/14) Yield Contribution
US Total Stock
Vanguard Total Stock Market Fund (VTI, VTSAX)
24% 1.78% 0.43%
US Small Value
WisdomTree SmallCap Dividend ETF (DES)
3% 2.81% 0.08%
International Total Stock
Vanguard Total International Stock Market Fund (VXUS, VTIAX)
24% 3.35% 0.80%
Emerging Markets Small Value
WisdomTree Emerging Markets SmallCap Dividend ETF (DGS)
3% 2.97% 0.09%
US Real Estate
Vanguard REIT Index Fund (VNQ, VGSLX)
6% 3.51% 0.21%
Intermediate-Term High Quality Bonds
Vanguard Limited-Term Tax-Exempt Fund (VMLUX)
20% 1.70% 0.34%
Inflation-Linked Treasury Bonds
Vanguard Inflation-Protected Securities Fund (VAIPX)
20% 1.78% 0.36%
Totals 100% 2.31%


The total weighted yield was 2.31%, as opposed to 2.49% calculated last quarter. This means that if I had a $1,000,000 portfolio balance today, it would have generated $23,100 in interest and dividends over the last 12 months. Now, 2.31% is significantly lower than the 4% withdrawal rate often recommended for 65-year-old retirees with 30-year spending horizons, and is also lower than the 3% withdrawal that I prefer as a rough benchmark for early retirement. Hurray for zero interest rates!

So how am I doing? Using my 3% benchmark, the combination of ongoing savings and recent market gains have us at 90% of the way to matching our annual household spending target. Using the 2.31% number, I am only 69% of the way there. That’s a big difference, and something I’ll have to reconcile. Consider that if all your portfolio did was keep up with inflation each year (0% real returns), you could still spend 2% a year for 50 years. From that perspective, a 2% spending rate seems extremely cautious.