Search Results for: High Interest Savings

My Money Blog Portfolio Asset Allocation and Performance Tracking, Year-End 2018

portpie_blank200

Here’s my final quarterly portfolio update for Q4 2018. This is how I track my real-world holdings, including 401k/403b/IRAs and taxable brokerage accounts but excluding our house, cash reserves, and a few side investments. The goal of this portfolio is to create enough income to cover our household expenses. As of 2018, we are “semi-retired” and have started spending a portion of our dividends and interest from this portfolio.

Actual Asset Allocation and Holdings

I use both Personal Capital and a custom Google Spreadsheet to track my investment holdings. The Personal Capital financial tracking app (free, my review) automatically logs into my accounts, adds up my balances, tracks my performance, and calculates my asset allocation. I still use my manual Google Spreadsheet (free, instructions) because it helps me calculate how much I need in each asset class to rebalance back towards my target asset allocation.

Here are my YTD performance and current asset allocation visually, per the “Holdings” and “Allocation” tabs of my Personal Capital account, respectively:

Stock Holdings
Vanguard Total Stock Market Fund (VTI, VTSMX, VTSAX)
Vanguard Total International Stock Market Fund (VXUS, VGTSX, VTIAX)
WisdomTree SmallCap Dividend ETF (DES)
Vanguard Small Value ETF (VBR)
Vanguard Emerging Markets ETF (VWO)
Vanguard REIT Index Fund (VNQ, VGSIX, VGSLX)

Bond Holdings
Vanguard Limited-Term Tax-Exempt Fund (VMLTX, VMLUX)
Vanguard Intermediate-Term Tax-Exempt Fund (VWITX, VWIUX)
Vanguard Intermediate-Term Treasury Fund (VFITX, VFIUX)
Vanguard Inflation-Protected Securities Fund (VIPSX, VAIPX)
Fidelity Inflation-Protected Bond Index Fund (FIPDX)
iShares Barclays TIPS Bond ETF (TIP)
Individual TIPS securities
U.S. Savings Bonds (Series I)

Target Asset Allocation. Our overall goal is to include asset classes that will provide long-term returns above inflation, distribute income via dividends and interest, and finally offer some historical tendencies to balance each other out. I make a small bet that US Small Value and Emerging Markets will have higher future long-term returns (along with some higher volatility) than the more large and broad indexes, although I could be wrong. I don’t hold commodities, gold, or bitcoin as they don’t provide any income and I don’t believe they’ll outpace inflation significantly.

I believe that it is important to imagine an asset class doing poorly for a long time, with bad news constantly surrounding it, and only hold the ones where you still think you can maintain faith based on a solid foundation of knowledge and experience.

Stocks Breakdown

  • 38% US Total Market
  • 7% US Small-Cap Value
  • 38% International Total Market
  • 7% Emerging Markets
  • 10% US Real Estate (REIT)

Bonds Breakdown

  • 50% High-quality, Intermediate-Term Bonds
  • 50% US Treasury Inflation-Protected Bonds

I have settled into a long-term target ratio of 67% stocks and 33% bonds (2:1 ratio) within our investment strategy of buy, hold, and occasionally rebalance. (Small changes to 65/35 or 70/30 are also fine.) With a self-managed, simple portfolio of low-cost funds, we minimize management fees, commissions, and taxes.

Holdings commentary. On the bond side, I still like high-quality bonds with a short-to-intermediate duration of under 5 years or so. This means US Treasuries, TIPS, or investment-grade municipal bonds. I don’t want to worry about my bonds. Right now, my bond portfolio is about 1/3rd muni bonds, 1/3rd treasury bonds, and 1/3rd inflation-linked treasury bonds (and savings bonds).

On the stocks side, I made a few comments in my 2018 year-end asset class return review. US stocks went down in 2018, but international and emerging markets stocks did even worse. On the flipside, international and emerging markets are a lot cheaper based on various metrics. I remain satisfied with my mix, knowing that I will own whatever successful businesses come out of the US, China, or wherever in the future.

Performance commentary. According to Personal Capital, my portfolio went down 6.9% in 2018. I see that during the same period the S&P 500 has lost 6% (excludes dividends), Foreign Developed stocks lost 14%, and the US Aggregate bond index was basically flat. Of course I didn’t want to see my value fall, but most of the change was due to a lower P/E ratio as opposed to lower earnings from companies.

An alternative benchmark for my portfolio is 50% Vanguard LifeStrategy Growth Fund and 50% Vanguard LifeStrategy Moderate Growth Fund – one is 60/40 and the other is 80/20 so it also works out to 70% stocks and 30% bonds. That benchmark would have a total return of -5.9% for 2018.

I’ll share about more about the income aspect in a separate post.

Financial Freedom Is About Resilience to Outside Shocks

I found myself thinking a lot today about General Motors announcing layoffs for over 14,000 employees – 6,000 hourly and 8,000 salaried workers. This affected the factory workers making the cars, engineers designing the cars, managers, and executives. I know one of those workers.

When you talk about the pursuit of financial freedom, often you may have a vision of sunny beaches and European cruises. Younger folks may be thinking instead about a cross-country RV trip with the entire family or spending a year hiking across Southeast Asia.

But instead of being aspirational, I have to admit that my pursuit started with a basis in fear. I am afraid of being broke, bankrupt, or having to beg someone else for help. I hate, hate, hate not being control. Most households do not have the ability to withstand a few months of unemployment without major disruption. I can’t stand that feeling of vulnerability.

Financial freedom is not a black and white thing. It is a gradual process of increasing your resilience to things outside your control.

  • Once you save up $500, you can withstand a car breakdown or a broken appliance. You don’t pay for your rent in weekly increments. You can pay for minor things without starting a cycle of debt that eventually spins out of control.
  • Once you have a couple of months of expenses saved up, you can withstand a decent-sized medical bill or a series of bad luck that would otherwise send you into high-interest debt.
  • Once you have a year of expenses saved up, you can withstand a layoff and short-term unemployment. You have the ability to move to a better geographic location to pursue better opportunities. You have options. You are not stuck.
  • Once you have a few years of expenses saved up, you can withstand a layoff and longer-term unemployment. You can train yourself for something different, something better, something more aligned with your values. With or without a primary job, you can take some risks, perhaps start a new business venture.
  • Once you have more than 10 years of expenses saved up, honestly, you have more money saved up than most people ever will at any age. If you reach this point, you probably have a system in place where it is likely just a matter of time until your investments grow that amount ever higher.

GM says they are trying to save money while times are good. Individual workers may need to have the same idea. From the Reuters article Money disasters can derail retirement:

Contrary to popular retirement saving strategies that are based on the assumption that procrastination is the root of the problem, the Rand researchers think there should be more focus on the probability of money disasters, which are much more common than most people assume. That scare would get people to focus on saving more during good times.

Many of my friends are that mix of skilled and lucky that the last time they involuntarily ended their job, they quickly found another job that paid even more. Maybe you’re one of those people too. But in the next big recession, which may or may not arrive soon, things might not be so easy.

Karyn Golden’s income was approaching $200,000 as she lived a carefree single existence at the peak of her career in Chicago, 20 years ago. She brokered real estate deals, served on boards and lunched with political leaders. She never imagined she would be where she is now – 70 and down to her last $200 in savings.

My Money Blog Portfolio Asset Allocation, October 2018

portpie_blank200

Here’s my quarterly portfolio update for Q3 2018. These are my real-world holdings and includes 401k/403b/IRAs and taxable brokerage accounts but excludes our house, cash reserves, and a few side investments. The goal of this portfolio is to create enough income to cover our household expenses. As of 2018, we are “semi-retired” and have started spending some dividends and interest from this portfolio.

Actual Asset Allocation and Holdings

I use both Personal Capital and a custom Google Spreadsheet to track my investment holdings. The Personal Capital financial tracking app (free, my review) automatically logs into my accounts, tracks my balances, calculates my performance, and gives me a rough asset allocation. I still use my custom Rebalancing Spreadsheet (free, instructions) because it tells me exactly how much I need in each asset class to rebalance back towards my target asset allocation.

Here is my portfolio performance for the year and rough asset allocation (real estate is under alternatives), according to Personal Capital:

Here is my more specific asset allocation broken down into a stocks-only pie chart and a bonds-only pie chart, according to my custom spreadsheet:

Stock Holdings
Vanguard Total Stock Market Fund (VTI, VTSMX, VTSAX)
Vanguard Total International Stock Market Fund (VXUS, VGTSX, VTIAX)
WisdomTree SmallCap Dividend ETF (DES)
Vanguard Small Value ETF (VBR)
Vanguard Emerging Markets ETF (VWO)
Vanguard REIT Index Fund (VNQ, VGSIX, VGSLX)

Bond Holdings
Vanguard Limited-Term Tax-Exempt Fund (VMLTX, VMLUX)
Vanguard Intermediate-Term Tax-Exempt Fund (VWITX, VWIUX)
Vanguard Intermediate-Term Treasury Fund (VFITX, VFIUX)
Vanguard Inflation-Protected Securities Fund (VIPSX, VAIPX)
iShares Barclays TIPS Bond ETF (TIP)
Individual TIPS securities
U.S. Savings Bonds (Series I)

Target Asset Allocation. Our overall goal is to include asset classes that will provide long-term returns above inflation, distribute income via dividends and interest, and finally offer some historical tendencies to balance each other out. I personally believe that US Small Value and Emerging Markets will have higher future long-term returns (along with some higher volatility) than US Large/Total and International Large/Total, although I could be wrong. I don’t hold commodities, gold, or bitcoin as they don’t provide any income and I don’t believe they’ll outpace inflation significantly.

I believe that it is important to imagine an asset class doing poorly for a long time, with bad news constantly surrounding it, and only hold the ones where you still think you can maintain faith.

Stocks Breakdown

  • 38% US Total Market
  • 7% US Small-Cap Value
  • 38% International Total Market
  • 7% Emerging Markets
  • 10% US Real Estate (REIT)

Bonds Breakdown

  • 50% High-quality, Intermediate-Term Bonds
  • 50% US Treasury Inflation-Protected Bonds

I have settled into a long-term target ratio of 67% stocks and 33% bonds (2:1 ratio) within our investment strategy of buy, hold, and occasionally rebalance. With a self-managed, simple portfolio of low-cost funds, we minimize management fees, commissions, and taxes.

Holdings commentary. On the bond side, as Treasury rates have risen, last quarter I sold my shares of Vanguard High-Yield Tax Exempt and replaced it with Vanguard Intermediate-Term Treasury. I liked the slightly higher yield of that (still pretty high quality) muni fund, but as I settle into semi-retirement mode, I don’t want to worry about the potential of state pension obligations making the muni market volatile. In addition, my tax bracket is lower now and the Federal tax-exempt benefits of muni bonds relatively to the state tax-exempt benefit of Treasury bonds is much smaller now. On a very high level, my bond portfolio is about 1/3rd muni bonds, 1/3rd treasury bonds, and 1/3rd inflation-linked treasury bonds (and savings bonds). These are all investment-grade and either short or intermediate term (average duration of 6 years or less).

No real changes on the stocks side. I know that US stocks have higher valuations, but that’s something that is already taken into account with my investment plan as I own businesses from around the world and US stocks are only about 30% of my total portfolio. I have been buying more shares of the Emerging Markets index fund as part of my rebalancing with new dividends and interest. I am considering tax-loss harvesting some older shares with unrealized losses against another Emerging Markets ETF.

The stock/bond split is currently at 68% stocks/32% bonds. Once a quarter, I reinvest any accumulated dividends and interest that were not spent. I don’t use automatic dividend reinvestment.

Performance commentary. According to Personal Capital, my portfolio now slightly down in 2018 (-2.7% YTD). I see that during the same period the S&P 500 has gained 5% (excludes dividends), Foreign (EAFA?) stocks are down 8.2%, and the US Aggregate bond index is down 2.4%. My portfolio is relatively heavy in international stocks which have done worse than US stocks so far this year.

An alternative benchmark for my portfolio is 50% Vanguard LifeStrategy Growth Fund (VASGX) and 50% Vanguard LifeStrategy Moderate Growth Fund (VSMGX), one is 60/40 and one is 80/20 so it also works out to 70% stocks and 30% bonds. That benchmark would have a total return of +0.07% YTD (as of 10/16/18).

I’ll share about more about the income aspect in a separate post.

Ally Bank Payback Time Promotion: 1% Additional Cash Bonus (~6% APY 3-month CD)

Ally Bank has a new promotion called Ally Payback Time that is offering a 1% cash bonus (up to $1,000) on new deposits on top of their existing interest rates. Valid for both new and existing customers. Given the holding period, this roughly equates to the same total interest paid as a 3-month bank CD at 6% APY. Here’s how it works:

  • Enroll by 10/21/18 at ally.com/payback. You must enroll or you won’t get the bonus. Existing customers must enroll with the same e-mail as linked to their Ally bank account.
  • Fund account by 10/31/18. This means your account has to be approved, opened and funded by this date. Technically the terms state that the funds must arrive by 11/5/18, but that is likely just a grace period and you should initiate any fund transfers by 10/31/18.
  • Maintain funds through 1/15/19. You must keep your new funds there through 1/15/19. This is really only a 2.5 month period if you waited until the last moment. Withdrawals may lower your bonus.
  • Get cash bonus on 2/15/19. After another 30 days, they will deposit your cash bonus into your Ally account.

To be clear, the bonus applies to new funds added to an eligible Ally bank account, not your total balance. Eligible accounts include Ally Online Savings, Money Market, Interest Checking, and CD accounts.

Rough math. The current rate on the Ally Online Savings account is 1.90% APY, and the 11-month No Penalty CD is 2.10% APY on $25k+ balances (as of 10/15/18). Given that you can an additional 1% bonus in a bit under 3 months, the bonus itself works out to the equivalent of a 4% annualized yield. 2% plus 4% = 6%, so you’re looking at the equivalent of a 3-month CD at 6% APY for new money deposits between $1,000 and $100,000. At such a high yield, this promo is a “no-brainer” when compared to other liquid savings accounts for the next 3 months.

The promo page has a calculator to show you your total cash earned over a year. If you move over $10,000 at 1.90% APY, you’d get $190 of interest in a year plus a $100 bonus = $290 total. That would work out to a total of 2.9% APY if you were lazy and just kept it all there for a year. Still not too shabby.

Should I move money out of Ally and back in to qualify? No, it won’t make any difference as Ally has already thought of that. All new funds added after 10/8/18 will count as new money for this promotion. They’ve already set the start date in the past, so you gain nothing by delaying your enrollment.

Existing customers. As a longtime Ally accountholder, I’m happy to see that this offer includes existing customers, even if it has to be new money. The promotion should be called the “Ally Money Comeback Time” as lots of people are probably bringing back funds that in the past year or so.

Payback Time? This YouTube ad explains the meaning behind “Payback Time”, basically the megabanks pay you no interest and keep it for themselves:

Bottom line. Ally Bank has a new promotion to attract new money (or bring back old money). You get a 1% cash bonus (up to $1,000) on new deposits on top of their existing interest rates. For their savings account, this works out to a 3-month holding period paying roughly 6% annualized interest. You must enroll soon by 10/21 and your account must be opened and fully funded by 11/5/18 at the very latest.

How To Compare Treasury Bill Rates to Bank Account APY

With T-Bill rates now around 2%, here’s another topic that is getting some interest for the first time in many years. Individual investors can buy short-term Treasury Bills (4, 13, 26, and 52 weeks) via non-competitive bid at either TreasuryDirect.gov or from a brokerage account with a bond desk. (I’ve used Fidelity and Vanguard in the past.) You can find Treasury Bill rates at several places, but here are the official sources:

An individual investor might ask – How do I compare Treasury Bill rates to Savings Account interest rates? Here is a step-by-step walkthrough to convert from the weekly auction results to a bank’s quoted APY interest rate.

Find the investment rate (not discount rate) from the recent auction results page. This is the equivalent of Annual Percentage Rate (APR). It is based on a 365-day year and reflects the annualized rate to maturity. Here’s the most recent snapshot from 9/13/2018:

Let’s take the 4-week (28-day) T-Bill, which has an APR of 2.006%, or 0.02006.

Convert this rate to APY. Annual Percentage Yield (APY), as opposed to APR, takes into account the effect of compounding interest. It’s also a higher number, which is why most banks just tell you the APY. An approximate way to convert it to APY is using this formula:

APY = (1 + (APR/PeriodsInAYear) )^(PeriodsInAYear) - 1

For our case, the APR is 0.02006 and PeriodsInAYear = 365/28. You could just copy and paste this formula into a Google box:

(1 + (0.02006/(365/28)))^(365/28) - 1

The resulting number is 0.2024, or 2.02% APY. Since rates are still relatively low, the difference between APR and APY will be small over a year.

Note that you can’t actually reinvest all of the money from a maturing T-Bill directly into a new T-Bill. For example, you might get back $1,000 from your first T-Bill, but can only reinvest $995 of it in the next T-Bill. The rest must sit in a savings account (with a competitive interest rate hopefully).

If you don’t pay state or local income taxes, you can stop here. As you can see, it’s very competitive with high-yield savings accounts.

Adjust for state and local taxes to find Your Tax-Equivalent Rate. Treasury Bills are exempt from state and local taxes. If you have to pay state and/or local taxes on bank interest, then this may put T-Bills ahead by a bit more. You can use my tax-equivalent yield calculator for this purpose. You’ll need to know your marginal tax rates and whether you can deduct your state taxes paid on your federal tax return.

Let’s say you are in the 22% bracket federally, 9% for state, and will itemize. For that situation, this specific 4-week T-Bill will earn the same amount of interest (after taxes) as a bank account earning 2.28% APY. You can do the same thing to the 3-month, 6-month, and 1-year T-Bills (13 week, 26 week and 52 week, technically). You may (or may not) find this final number to be more attractive than a bank account.

Also see: How To Build A 4-Week Treasury Bill Ladder: A Visual Guide

Are You Quietly Losing Money via Your Brokerage Cash Sweep Account?

A recent WSJ article by Jason Zweig calls attention to one of the hidden ways that brokerage firms make money from you. As interest rates rise, they go out and earn the highest market rates while giving you a lot less on your idle cash. The difference adds up to big profits.

Brokerage accounts used to make you buy a money market fund with a high expense ratio. These days, they use a “bank sweep” account. They advertise the FDIC insurance, but hide the fact that they often own the bank and are skimming millions in interest:

In a bank sweep, your brokerage automatically rakes together and deposits your spare cash in one or more banks. Banks hand the brokerage a hefty fee, and the brokerage hands you some crumbs. For any given investor, a few dollars from dividends or interest income don’t amount to much. Rolled together with idle cash from thousands of other investors, they can add up to millions.

Morgan Stanley. Ameriprise. E-Trade. If you dig through Schwab’s disclosure, you’ll see them state that “In setting interest rates, the affiliated banks may seek to pay as low a rate as possible”. Nice.

Default options often prey on your inattention and laziness. Here are some ways to avoid the low interest rates of the bank sweep accounts.

  • Explore all your sweep options. Some places give you multiple alternatives for your cash sweep. For example, Fidelity has Fidelity Government Money Market Fund (SPAXX), Fidelity Treasury Fund (FZFXX), and FCASH. The two funds have SEC yields over 1.5% right now, while FCASH earns only 0.25% on balances under $100,000.
  • Keep your cash accounts empty automatically. You can set up automatic dividend reinvestment, or perhaps an automatic deposit of dividends into a high yield savings account. That should keep most of your interest and dividends from piling up as cash.
  • Manually reinvest often or transfer to alternative funds. Keep an eye on your cash balance, and invest it as soon as possible into stocks, bonds, or a higher-yielding money market fund alternative. Some accounts offer a text alert if you balance exceeds a certain amount like $1,000.
  • Move your assets to another firm. Vanguard still has a decent sweep option (VMMXX, see below). Fidelity still has two decent money market sweep options as well (SPAXX and FZFXX).

Vanguard isn’t incentivized to play these interest-skimming games. Vanguard’s only sweep account nowadays is the Vanguard Federal Money Market fund due to new regulations (read more here). Vanguard used to have better options as the default account, but at least the Vanguard Federal Money Market fund still earns a decent SEC yield of 1.87% (as of 8/8/18). If you want, you can still move money manually into the Vanguard Prime Money Market fund, Vanguard Municipal Money Market funds, and the Vanguard Treasury Money Market fund which may do better on an after-tax basis.

On the flip side, if you are individual stock investor, this is why higher interest rates are good for brokerage firms like Schwab. If you believe in the future of low-cost index funds, Fidelity and Vanguard are not publicly-traded, but you can become a shareholder in Schwab. Heck, Schwab has even set up their “free” robo-advisor to profit from higher interest rates due to a sizable cash allocation. (I do not hold Schwab stock at the time of this writing, but it is on my watchlist.)

Bottom line. Check the interest rate on your brokerage sweep account – It might be a lot lower than you think. Consider taking action.

My Money Blog Portfolio Asset Allocation, July 2018

portpie_blank200

Here’s my quarterly portfolio update for Q2 2018. These are my real-world holdings and includes 401k/403b/IRAs and taxable brokerage accounts but excludes our house, cash reserves, and a few side investments. The goal of this portfolio is to create enough income to cover our regular household expenses. As of 2018, we are “semi-retired” and spending some of the dividends and interest from this portfolio.

Actual Asset Allocation and Holdings

I use both Personal Capital and a custom Google Spreadsheet to track my investment holdings. The Personal Capital financial tracking app (free, my review) automatically logs into my accounts, tracks my balances, calculates my performance, and gives me a rough asset allocation. I still use my custom Rebalancing Spreadsheet (free, instructions) because it tells me where and how much I need to direct new money to rebalance back towards my target asset allocation.

Here is my portfolio performance for the year and rough asset allocation (real estate is under alternatives), according to Personal Capital:

Here is my more specific asset allocation, according to my custom spreadsheet:

Stock Holdings
Vanguard Total Stock Market Fund (VTI, VTSMX, VTSAX)
Vanguard Total International Stock Market Fund (VXUS, VGTSX, VTIAX)
WisdomTree SmallCap Dividend ETF (DES)
Vanguard Small Value ETF (VBR)
Vanguard Emerging Markets ETF (VWO)
Vanguard REIT Index Fund (VNQ, VGSIX, VGSLX)

Bond Holdings
Vanguard Limited-Term Tax-Exempt Fund (VMLTX, VMLUX)
Vanguard Intermediate-Term Tax-Exempt Fund (VWITX, VWIUX)
Vanguard High-Yield Tax-Exempt Fund (VWAHX, VWALX)
Vanguard Inflation-Protected Securities Fund (VIPSX, VAIPX)
iShares Barclays TIPS Bond ETF (TIP)
Individual TIPS securities
U.S. Savings Bonds (Series I)

Target Asset Allocation. Our overall goal is to include asset classes that will provide long-term returns above inflation, distribute income via dividends and interest, and finally offer some historical tendencies to balance each other out. I personally believe that US Small Value and Emerging Markets will have higher future long-term returns (along with some higher volatility) than US Large/Total and International Large/Total, although I could be wrong. I don’t hold commodities, gold, or bitcoin as they don’t provide any income and I don’t believe they’ll outpace inflation significantly.

I think it’s important to imagine an asset class doing poorly for a long time, with bad news constantly surround it, and only hold the ones where you still think you can maintain faith.

Stocks Breakdown

  • 38% US Total Market
  • 7% US Small-Cap Value
  • 38% International Total Market
  • 7% Emerging Markets
  • 10% US Real Estate (REIT)

Bonds Breakdown

  • 50% High-quality, Intermediate-Term Bonds
  • 50% US Treasury Inflation-Protected Bonds

I have settled into a long-term target ratio of 67% stocks and 33% bonds (2:1 ratio) within our investment strategy of buy, hold, and occasionally rebalance. With a self-managed, simple portfolio of low-cost funds, we minimize management fees, commissions, and taxes.

Real-world asset allocation details. No major changes from the last quarterly update. For both simplicity and cost reasons, I am no longer buying DES/DGS and will be phasing them out whenever there are tax-loss harvesting opportunities. New money is going into the more “vanilla” Vanguard versions: Vanguard Small Value ETF (VBR) and Vanguard Emerging Markets ETF (VWO).

My taxable muni bonds are split roughly evenly between the three Vanguard muni funds with an average duration of 4.5 years. I am still pondering going back to US Treasuries due to changes in relative interest rates and our marginal income tax rate. Issues with high-quality muni bonds are unlikely, but still a bit more likely than US Treasuries.

The stock/bond split is currently at 70% stocks/30% bonds. Once a quarter, I reinvest any accumulated dividends and interest that were not spent. I don’t use automatic dividend reinvestment. Looks like we need to buy more bonds and emerging markets stocks.

Performance and commentary. According to Personal Capital, my portfolio has basically broken even so far in 2018 (+1.5% YTD). I see that during the same period the S&P 500 has gained 6.5% (excludes dividends) and the US Aggregate bond index lost 1.7%. My portfolio is relatively heavy in international stocks which have done worse than US stocks so far this year.

An alternative benchmark for my portfolio is 50% Vanguard LifeStrategy Growth Fund (VASGX) and 50% Vanguard LifeStrategy Moderate Growth Fund (VSMGX), one is 60/40 and one is 80/20 so it also works out to 70% stocks and 30% bonds. That benchmark would have a total return of +2.8% YTD (as of 7/25/18).

As usual, I’ll share about more about the income aspect in a separate post.

Northern Bank Direct Money Market Review – 2.26% APY Guaranteed Through June 2019

Update: As of 6/20/18, the rate is now down to 1.50% APY. I hope everyone who was interested got the 2.26% APY rate, you definitely had time and they did give roughly a 24-hour notice.

Here comes another new “Direct” bank leapfrogging the current competition for some attention. The Northern Bank Direct Money Market account is offering 2.26% APY on average daily balances up to $250,000, and the rate is guaranteed through June 30, 2019. Of course, another bank could take the throne tomorrow, but at least this one comes with a rate guarantee. Other highlights:

  • $5,000 minimum to open.
  • Includes limited checkwriting and ATM debit card access.
  • No minimum balance requirements or monthly service charges.
  • Interest is compounded monthly and credited monthly. If you close your account before the interest is credited, you will not receive the accrued interest.
  • Read full review for notable quirks.

Northern Bank Direct is the online division of Northern Bank, a community bank in the New England area. You must open accounts online, but you can do transactions in their branches and use the NBTC Mobile Banking apps. They also offer various certificates of deposit, including currently a 30-month CD at 3.01% APY ($500 minimum to open, 12-month early withdrawal penalty). Their routing number is 011303097. You can contact them at 844-348-8996 EST Monday-Friday: 9a-6p, or via email to nbdirect@nbtc.com.

Money Market features. This is a money market account, which is similar to a savings account but adds limited checkwriting and an ATM debit card. You are still limited to 6 withdrawals per month, whether via online electronic funds transfer, check, wire, or ATM machine.

ACH limitations. Northern Bank Direct has a somewhat weird rule that if you initiate a electronic transfer from your Northern Bank Direct account, there is a maximum daily limit of $5,000.00 (or the available balance in your account, whichever is less) for Interbank (external) transfers per transaction; $5,000 in aggregate per day; and $25,000 in aggregate per calendar month. If you initiate the electronic transfer from an external financial institution, Northern Bank Direct does not impose a limit on the amount of the transfer.

Notable fees. According to their full Deposit Account Agreement, there are a few other fees that caught my eye:

  • Account closure (by mail): $10
  • Dormant Accounts fee (per month– starting in the 13th month for account balances less than $500.00): $4.00
  • External Transfer Fee (per transfer): $3
  • New account closure within 120 days: $25

It appears that not only do they limit your transactions to $5,000 per day ($25,000 per month), they will also charge you $3 if you initiate the transfer from your Northern Bank Direct account. There are some reports that they are removing the $3 fee, but I still see it on their online fee schedule. Hopefully, you already have a favorite “hub” bank account with free, fast transfers and high dollar limits (mine is Ally Bank).

These fees are notable as other online savings accounts have all of the following: no minimum opening balance, no minimum balance requirement, no early closure fee, and/or no inactivity fee.

Smartphone app. It’s amazing how much I bank from my phone these days, from checking balances to mobile check deposit. Based on the app store screenshots, it looks like Northern Bank also outsourced their back-end software to Fidelity National Information Services (subdomain ibanking-services.com). In my experience, the app is basic but functional. Mobile check deposit and Touch ID are supported.

Bottom line. The Northern Bank Direct Money Market account is offering 2.26% APY on average daily balances up to $250,000, with the rate guaranteed through June 30, 2019 ($5,000 minimum to open). In terms of liquid savings accounts, this is the highest rate currently available (with a few quirks noted above). There are a few short-term CDs with higher rates (and withdrawal penalties), but this is more like a no-penalty CD plus you can also add funds at any time. If you have a large cash balance and you want to preserve your liquidity options, this is something to consider. Act fast though, as previous similar accounts have closed to new applications after a few weeks.

Check out my Ultimate Rate-Chaser Calculator to estimate how much additional interest you’d earn if you switched over and make an informed decision.

How To Build A 4-Week Treasury Bill Ladder: A Visual Guide

For my magic trick today, I will be resurrecting a post from over 11 years ago! That’s the last time it there was any significant interest for an individual to buy Treasury Bills instead of using a top-yielding bank account. As of 6/18/18, a 4-week T-Bill rose to a 1.83% yield. Since T-Bill interest is exempt from state and local income taxes, your tax-equivalent yield could top 2% today.

This is a short visual guide on creating a Treasury Bill ladder, which maximizes your liquidity. If you use the TreasuryDirect website, it now includes an option for automatic reinvestment upon maturity, which makes things even easier after the initial setup.

Quick Facts

  1. Treasury Bills are purchased at a discount and redeemed at the full par value. So for each $1,000 worth, you’ll pay ~$99x dollars upon issue and receive $1000 upon maturity.
  2. You can either buy them at TreasuryDirect.gov, or from a brokerage firm that offers a bond desk like Fidelity, Vanguard, TD Ameritrade, etc.
  3. Rates are set by auction, so you will not know your exact interest rate before you commit to buy. You can look at historical rates to help get you a ballpark estimate.
  4. 4-week T-Bill auctions are normally held on Tuesdays, and the T-Bills both issue and mature on Thursdays. Here is a list of upcoming auctions.
  5. You must schedule your non-competitive bid before 11am Eastern time on the auction date (Tuesdays), otherwise you are pushed to next week. (TreasuryDirect now allows automatic reinvestment upon maturity for up to 2 years.)
  6. The transfer of money to/from your bank account upon purchase/maturity is well-synchronized. That is, if one Treasury Bill matures (deposits $1,000) and another is issued on the same day (withdraws $995), your bank account should have a net positive $5 balance at the end of that day.

Visual Guide To Setting Up A Treasury Bill Ladder
Laddering is a method of purchasing that increases the liquidity of fixed term investments such as Treasury Bills. Imagine if you bought a T-Bill every week, and each one lasts for 4 weeks. After four weeks, you could simply use the proceeds of your first T-Bill to purchase your fifth T-Bill. The week after that, you could use the proceeds from your second T-Bill to purchase your 6th T-Bill, and so on forever. If you stopped buying T-Bills, you would get $1,000 back each week until all have matured.

TreasuryDirect now has a minimum purchase amount of $100, allowed in increments of $100. This means you would need to commit 4 x $100 = $400 to create a weekly ladder. Other brokerage firms may impose a higher $1,000 minimum per T-Bill. If you don’t have enough, you can simply buy them at less frequent intervals. Below are four visual examples for buying a $1,000 T-Bill every month, every two weeks, and every week:

Monthly Ladder of $1,000 T-Bills ($1,000 committed)
Assuming a discount value of $995:
Week #1: T-Bill #1 will be issued on Thursday (net taken from bank account: -$995)
Week #5: T-Bill #1 will mature (+$1,000) and T-Bill #2 will be issued (-$995) on Thursday (net: -$990)
(and so on…)


In some months, there may be a gap between the T-Bill maturing and the next one issuing, but you should never have more than $1,000 invested “outside” in T-Bills. However, you may have to wait up to 28 days for your money to come back to you.

Bi-Weekly Ladder of $1,000 T-Bills ($2,000 committed)
Week #1: T-Bill #1 issued on Thursday (net: -$995)
Week #3: T-Bill #2 issued on Thursday (-$1990)
Week #5: T-Bill #1 matures, T-Bill #3 issued on Thursday (-$1985)
Week #7: T-Bill #2 matures, T-Bill #4 issued on Thursday (-$1980)
Week #9: T-Bill #3 matures, T-Bill #5 issued on Thursday (-$1975)
(and so on…)

As you can see, you should never need more than $2,000 committed to T-Bills using a bi-weekly ladder. If you have $2,000, this would be a better way to set up your investments since in the worst case you can stop buying new T-Bills and get access to half your investment in 14 days once the ladder is constructed.

Weekly Ladder of $1,000 T-Bills ($4,000 committed)
Week #1: T-Bill #1 issued on Thursday (net: -$995)
Week #2: T-Bill #2 issued on Thursday (-$1990)
Week #3: T-Bill #3 issued on Thursday (-$2985)
Week #4: T-Bill #4 issued on Thursday (-$3980)
Week #5: T-Bill #1 matures, T-Bill #5 issued on Thursday (-$3975)
Week #6: T-Bill #2 matures, T-Bill #6 issued on Thursday (-$3970)
Week #7: T-Bill #3 matures, T-Bill #7 issued on Thursday (-$3965)
(and so on…)

Practical Details
If you don’t already have a preferred brokerage account, you can buy T-Bills online at TreasuryDirect.gov. Check out the TreasuryDirect Guided Tour for a walkthrough; It’s very similar to opening an online bank account. You will need to verify your identity with your Social Security Number, but there is no credit check. You will need a bank account as an initial source of funds.

After logging in, do not use “Purchase Express”, click on the “Buy Direct” tab on top instead, and choose “Bills”. Here is a screenshot of the entire purchase screen, including the option for automatic reinvestment (into another T-Bill of the same type and term):

If you choose your interval correctly, everything pretty much goes on autopilot. For a 4 x $1,000 weekly ladder, you would just set up 4 purchases and have them reinvest automatically for up to 2 years. Note that I chose both the source and destination of funds to be my bank account. If you are using a savings account, remember that they are limited to 6 withdrawals per month. If you want to avoid the extra transactions at the expense of a little bit of interest, you may choose to use the “Certificate of Indebtedness” as your source or destination account. Just think of it as a savings account that pays no interest that serves as a holding place for money. Obviously, you don’t want to keep too much in there.

Bottom line. Individuals can invest in Treasury Bills, which are Treasury Bonds with a maturity of one year or less. T-Bill interest rates are now competitive with top online bank accounts, even exceeding them in some cases due to the interest being exempt from state income taxes. Structuring them as a T-Bill ladder is a way to increase your liquidity. By creating a ladder of 4-week T-Bills maturing every week, you can always have access to 1/4th of your funds in a week, 1/2 of your funds in 2 weeks, and so on.

Personal Capital Review: Automatically Track Net Worth and Portfolio Asset Allocation

Personal Capital is free financial website and app that links all of your accounts to track your spending via bank and credit cards, investments, and net worth. You provide your login information, and they pull in the information for you automatically so you don’t have to type in your passwords every day on 7 different websites. Personal Capital’s strength is in investments, including portfolio tracking, performance benchmarking, and asset allocation analysis.

Net worth. You can add your home value, mortgage, checking/savings accounts, CDs, credit cards, brokerage, 401(k), and even stock options to build your customized Net Worth chart. You can also add investments manually if you’d prefer. I have a habit of accumulating bank and credit union accounts, so I find account aggregation quite helpful.

Cash flow. The Cash Flow section tracks your income and expenses by pulling in data from your bank accounts and credit cards. This chart compares where you are this month against the same time last month. If you hate budgeting, you may find it easier to view a real-time snapshot of your spending behavior. Their expense categorization tool is pretty accurate, and if it isn’t you can change it manually. However, it isn’t quite as advanced as Mint.com, where you for example you can make a rule to always classify “Time Warner Cable” as “Utilities” and not “Online Services”.

Portfolio. This is where Personal Capital is better than many competing services, by analyzing my overall asset allocation, holdings, and performance relative to benchmarks. If you’re like me, you have investments spread across multiple custodians. I now have investments at Vanguard, Fidelity (401k), Schwab, TransAmerica (401k), and Merrill Edge. It’s nice to be able to see everything together in one picture. They can also analyze your retirement accounts fees to see if you are quietly getting charged too much.

For comparison, Mint did not allow manual input of investments and it did not break down my asset allocation correctly based on my linked accounts. In fact, all it shows is a big orange pie chart with “99.9% Not Sure” and “0.00 Other”.

Personal Capital considers the major asset classes to be US stocks, International stocks, US Bonds, International Bonds, and Cash. The “Alternatives” classification includes Real Estate, Gold, Energy, and Commodities.

If you have one bank account, one credit card, and a 401(k), you may not need this type of account aggregation service. Life tends to get messy though, and this helps me maintain a high-level “big picture” view of things.

Security. As with most similar services, Personal Capital claims bank-level, military-grade security like AES 256-bit encryption. The background account data retrieval is run by Envestnet/Yodlee, which partners with other major financial institutions like Bank of America, Vanguard, and Morgan Stanley. Before you can access your account on any new device, you’ll receive an automated phone call, email, or SMS asking to confirm your identity. Their smartphone apps are compatible with Touch ID/Face ID on Apple and mobile PINs on Android devices.

In terms of the big picture, my opinion is that by making it more convenient, I am able to keep a closer eye on all my account and thus actually make myself less likely to be affected by a security issue.

How is this free? How does Personal Capital make money? Notice the lack of ads. Personal Capital makes money via an optional paid financial advisory service, and they are using this as a way to introduce themselves. (People who sign up for portfolio trackers tend to have money to manage…) They are a hybrid advisor, combining their online tools with real human access. Their management fees are 0.89% annually for the first $1 million, with slightly lowered pricing as you go past $1 million in assets. As an SEC-registered RIA fiduciary that now manages over $7 billion, I think this improves their credibility as a company built to handle sensitive information.

Note that if you give them your phone number, they will call you to offer a free financial consultation. If you answer the phone or e-mail them that you don’t want to be contacted anymore, they will honor that request. Or you could ask them your hardest financial question and see how they respond. However, if you simply ignore the phone calls, they will keep calling. Now, you can keep using the portfolio software for free no matter what happens. But, if you aren’t interested, I would highly recommend simply being upfront with them. A simple “no thank you” and you’re good.

If you’re upfront with them, they’ll be upfront with you. I’m still a DIY guy when it comes to my money, and they have been happy to keep monitoring my accounts for free, without any additional phone calls over the last 5 years.

Bottom line. It’s not what you make, it’s what you keep that counts. The free financial dashboard software from Personal Capital helps you track your net worth, cash flow, and investments. I recommend it for tracking stock and mutual fund investments spread across different accounts. I’d link your accounts on the desktop site, but interact daily through their Android/iPhone/iPad apps for optimal convenience (log in with Touch ID or mobile-only PIN).

Plastiq Promotion: Pay Bills w/ No Fee with Masterpass ($250 Max Per Bill)

plastiq_logo

New promo. Plastiq has a new promotion where you can pay a bill using a Mastercard in Masterpass with no fee. Expires 9/30/18. Thanks to readers Jon and Bill. Here are the restrictions and details:

From now until September 30, 2018, we will waive the Plastiq fee when you use Mastercard in Masterpass for the payment. This promotion applies to any bills or invoices up to a maximum of $250 each.

To qualify for this promotion, you must:

Use a Mastercard in Masterpass for the payments (read here on how to add a Mastercard in Masterpass to your Plastiq account).
Submit or schedule payments between June 1, 2018 12:00 a.m. ET and September 30, 2018 11:59 p.m. ET.
The payments’ delivery date must be before or on September 30, 2018.
There is no minimum or maximum amount required for the transaction.
If the amount is over $250, you will incur a Plastiq fee on the remaining amount over $250.
If you have signed up with a referral code, you will need to hit the required minimum of $500 in successful payments and receive the fee-free dollar credit in order to be eligible for this promotion.

To clarify, there is a $250 limit per payment, but no limit on the number of payments. You could split up a larger bill into $250 increments if the payee accepts that. You could convert a mortgage, home equity loan, student loan, tuition, or property tax payment into a credit card payment that earns rewards or fulfill a sign-up bonus. For example, with the Citi Double Cash Card, the 2% cash back means every $5,000 in purchases could earn $100 cash back.

Original post:

Plastiq.com lets you pay bills and invoices with a credit or debit card, even if they don’t usually accept them. The standard service fee is 2.5% for credit cards and 1% for Visa and MasterCard debit cards. However, they run limited-time promotion with lower fees. They will charge your card and send out a paper check to the payee (direct bank transfers to a few), so you’d want to plan ahead for any snail mail delays. They recommend 10 business days to be safe. More ideas from their site:

  • Rent or Mortgage
  • Homeowners Association (HOA) dues
  • Tuition
  • Childcare costs
  • Buying a car, RV, or ATV
  • Income or business taxes

plastiq2

(Note: This was only an example given during a 1.5% fee promotion. The current fee may be higher or lower.) Why would I want to pay a 1.5% service fee?

Sign-up bonus spending requirements. Sign-up bonuses often having spending requirements. For example, you might get a $500 value bonus but need to spend $5,000. Well, that’s effectively 10% back so if you need a little help to get over that hurdle, it’s okay to pay a 1.5% fee. Here are some recent cards with big $500 value bonuses but also spending requirements:

2% cash back credit cards, or similar. If you have a rewards credit card that offers 2% cash back (or equivalent value in points), then you can still make a slight profit by putting them on your credit card. A simple example is the Citi Double Cash Card. For example, if you have a tuition bill or tax bill of $5,000 and you earned 2% cash back while paying a 1.5% fee, your net 0.5% is $25.

Combine a rewards card + 0% APR on purchases. Many credit cards offer 0% APR on purchases for an introductory period of 12 months or longer. If the card also has a half-decent rewards program on purchases, the combination of purchase rewards and spreading out the payments over a year at no interest could be attractive.

Referral program. Plastiq has a somewhat confusing referral program. If a new user signs up via a referral link and pays $500 worth of bills, they will then get $500 “fee-free dollars”. So first you’d have to pay the fee on a bill, and then on your next bill, $500 of it will be “fee-free” (at 2.5% that’s a $12.50 savings). The referrer will get $1,000 in fee-free dollars. If you take advantage of the promo above, that should trigger the bonus. Here’s my referral link. Thanks if you use it.

Betterment Review: Customized Asset Allocation, Human Financial Advisors

bment1707_0
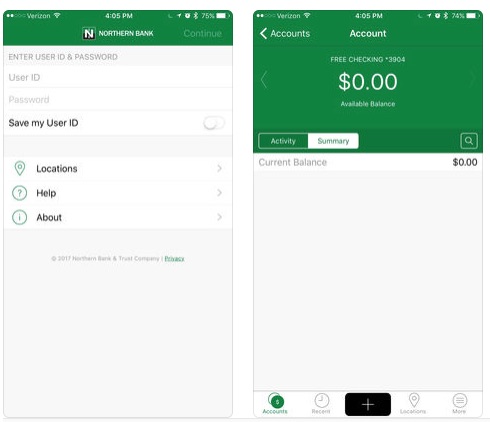
Updated April 2018 with custom ETF allocations. Betterment is an independent hybrid digital/human advisor that will manage a diversified mix of low-cost index funds and help you decide how much you’ll need to save for retirement. (By independent, I mean that they are not tied to a specific brand of funds like Vanguard or Schwab). Betterment is also an RIA, which means they have a legal fiduciary duty to keep client interests first. They frequently announce new features and improvements, so I will work to keep this feature list updated.

Diversified portfolio of high-quality, low-cost ETFs. Their portfolios are a diversified mix of several asset classes including: US Total, US Large Value, US Mid Value, US Small Value, International Developed, Emerging Markets, US Corporate Bonds, US Total Bond, Inflation-Protected Treasuries, Muni Bonds, International Bonds, and Emerging Market Bonds. For the most part, Vanguard and iShares ETFs are used.

The traditional Betterment portfolio has a more pronounced tilt towards the size premium and value premium than the cap-weighted indexes. You could argue the finer points of whether this will really create higher risk-adjusted returns, but overall it is backed by academic research. Betterment has also added a Socially Responsible Investing (SRI) portfolio option.

In April 2018, Betterment added Flexible Portfolios which lets you manually adjust the percentages of each asset class. As a DIY investor with assets spread across multiple accounts, this customization has been something I’ve been waiting for. This option is currently available only to clients with $100,000+ in assets.

betterment_flex

Both the SRI and Flexible Portfolio options will work with Tax Loss Harvesting and Tax Coordination features (see below).

Free access to human advice for everyone. In July 2017, Betterment announced that all of their customers can message a licensed financial experts. Digital members (0.25% annual fee) can ask questions any time via their mobile app. Digital members should expect an answer in approximately one business day. Betterment Premium members (0.40% annual fee) have unlimited e-mail and direct phone access to “Certified Financial Planner professionals”. From their press release:

Our experts can assist with deciding which funds to move to Betterment, setting goals (like saving for college, a house, or retirement), and identifying which Betterment tax features may be right. They can also help you make important investment decisions, like choosing risk levels, amounts to invest, and types of accounts.

Reading between the lines, Digital members get “licensed financial experts” while Premium members get “Certified Financial Planner professionals”. This suggests that while Digital members will still get fiduciary (client-first) advice, Premium members will get priority access to the more-experienced advisors in exchange for paying their higher fee.

bment1707

Retirement planning software with external account balances. RetireGuide is Betterment’s retirement planning software, first launched in April 2015. This service links your external accounts from other banks, brokerages, and 401k plans (similar to Mint and Personal Capital) in order to see your balances without having to manually input them. According to their methodology guide [pdf], they don’t analyze your transactions to estimate savings rate, they are just pulling in balances.

Example questions: How much do I have invested elsewhere? Am I saving enough money? How much estimated income will I have in retirement? Your future Social Security income is estimated for your based on your chosen retirement age and birthdate. You can change many of the variables as you like.

Account types. Betterment now supports taxable joint accounts, trust accounts, 401k rollovers, Traditional IRAs, Roth IRAs, SEP IRAs, and Inherited IRAs.

Tax-efficent asset location. Tax-Coordinated Portfolio will place different asset classes in your taxable accounts vs. tax-deferred accounts (IRAs, 401ks) for a higher after-tax return. In addition, if you have multiple types of accounts at Betterment (i.e. both IRA and taxable), it will manage multiple accounts as a single portfolio, placing assets that are taxed more into more favorably taxed accounts (like IRAs). Note that this only works across accounts that are held at Betterment. It does not adjust for non-Betterment accounts. This is called their Tax-Coordinated Portfolio (TCP).

Use dividends and new contributions to rebalance. They will use your dividends and new contributions to rebalance your asset classes in order to minimize sells and thus minimize capital gains.

Daily tax-loss harvesting. Betterment’s Tax-loss Harvesting+ (TLH+) software monitors your holdings daily and attempts to find opportunities to harvest tax losses by switching between “similar but not substantially identical” ETFs. If you can delay paying taxes and reinvest them, this can result in a greater after-tax return. The exact “tax alpha” of this practice depends on multiple factors like portfolio size and tax brackets. You can read the Betterment side of things in their whitepaper. Here is an outside viewpoint arguing for more conservative estimates.

My opinion is that there is long-term value in tax-loss harvesting and especially daily monitoring to capture more losses. However, I also think it’s wise to use a conservative assumption as to the size of that value. (DIY investors can perform their own tax-loss harvesting as well on a less-frequent basis. I do it myself, but it’s rather tedious and I’m definitely not doing it more often than once a year. I would gladly leave it to the bots if it was cheap enough.)

Invest your excess cash automatically. Automatic contributions are good, but perhaps you don’t want to commit to a set amount each month. (Ideally, you do commit to a set amount, and this service invests more money on top of that.) Called SmartDeposit, you link your checking account and choose your Checking Account Ceiling and Max Deposit amount. If your checking account balance goes above the ceiling, Betterment will automatically sweep over money and invest it for you. Betterment will account for future scheduled deposits so you don’t over-contribute.

Fee schedule. Betterment has a fee structure with two tiers.

  • Betterment Digital. No minimum balance. Digital portfolio management and guidance. Unlimited access to “licensed financial experts” via mobile app with ~1 business day turnaround time. Flat fee of 0.25% of assets annually. The management fee on any assets over $2 million is waived.
  • Betterment Premium. $100,000 minimum balance. Digital portfolio management and guidance. Unlimited access to “CFP professionals” financial experts” via e-mail or phone. Includes more in-depth advice on investments outside of Betterment. Flat fee of 0.40% of assets annually. The management fee on any assets over $2 million is waived.

In my opinion, the main concern of any outside advisor is the same: you are handing over control to someone else. Betterment could change their investment philosophy, their pricing structure, and feature set in the future. Digital advisors are constantly changing, and some of their new features could be great or it could just be a fad.

Bottom line. Betterment is an independent digital advisory firm with nearly $10 billion in assets, which means they aren’t tied to any specific brand of funds like Vanguard, Fidelity, or Schwab. Their main differentiators from the other independent firms (see my Wealthfront review) are (1) access to human advice available to all customers and now (2) the ability to customize your target asset allocation ($100k+ in assets). Other notable features include: Retirement planning software that syncs with external accounts, tax-loss harvesting, tax-coordinated portfolios (when you have both IRA/401k and taxable at Betterment), and SmartDeposit which automatically invests excess cash from your checking account.