
Here’s my quarterly portfolio update for Q3 2018. These are my real-world holdings and includes 401k/403b/IRAs and taxable brokerage accounts but excludes our house, cash reserves, and a few side investments. The goal of this portfolio is to create enough income to cover our household expenses. As of 2018, we are “semi-retired” and have started spending some dividends and interest from this portfolio.
Actual Asset Allocation and Holdings
I use both Personal Capital and a custom Google Spreadsheet to track my investment holdings. The Personal Capital financial tracking app (free, my review) automatically logs into my accounts, tracks my balances, calculates my performance, and gives me a rough asset allocation. I still use my custom Rebalancing Spreadsheet (free, instructions) because it tells me exactly how much I need in each asset class to rebalance back towards my target asset allocation.
Here is my portfolio performance for the year and rough asset allocation (real estate is under alternatives), according to Personal Capital:

Here is my more specific asset allocation broken down into a stocks-only pie chart and a bonds-only pie chart, according to my custom spreadsheet:

Stock Holdings
Vanguard Total Stock Market Fund (VTI, VTSMX, VTSAX)
Vanguard Total International Stock Market Fund (VXUS, VGTSX, VTIAX)
WisdomTree SmallCap Dividend ETF (DES)
Vanguard Small Value ETF (VBR)
Vanguard Emerging Markets ETF (VWO)
Vanguard REIT Index Fund (VNQ, VGSIX, VGSLX)
Bond Holdings
Vanguard Limited-Term Tax-Exempt Fund (VMLTX, VMLUX)
Vanguard Intermediate-Term Tax-Exempt Fund (VWITX, VWIUX)
Vanguard Intermediate-Term Treasury Fund (VFITX, VFIUX)
Vanguard Inflation-Protected Securities Fund (VIPSX, VAIPX)
iShares Barclays TIPS Bond ETF (TIP)
Individual TIPS securities
U.S. Savings Bonds (Series I)
Target Asset Allocation. Our overall goal is to include asset classes that will provide long-term returns above inflation, distribute income via dividends and interest, and finally offer some historical tendencies to balance each other out. I personally believe that US Small Value and Emerging Markets will have higher future long-term returns (along with some higher volatility) than US Large/Total and International Large/Total, although I could be wrong. I don’t hold commodities, gold, or bitcoin as they don’t provide any income and I don’t believe they’ll outpace inflation significantly.
I believe that it is important to imagine an asset class doing poorly for a long time, with bad news constantly surrounding it, and only hold the ones where you still think you can maintain faith.
Stocks Breakdown
- 38% US Total Market
- 7% US Small-Cap Value
- 38% International Total Market
- 7% Emerging Markets
- 10% US Real Estate (REIT)
Bonds Breakdown
- 50% High-quality, Intermediate-Term Bonds
- 50% US Treasury Inflation-Protected Bonds
I have settled into a long-term target ratio of 67% stocks and 33% bonds (2:1 ratio) within our investment strategy of buy, hold, and occasionally rebalance. With a self-managed, simple portfolio of low-cost funds, we minimize management fees, commissions, and taxes.
Holdings commentary. On the bond side, as Treasury rates have risen, last quarter I sold my shares of Vanguard High-Yield Tax Exempt and replaced it with Vanguard Intermediate-Term Treasury. I liked the slightly higher yield of that (still pretty high quality) muni fund, but as I settle into semi-retirement mode, I don’t want to worry about the potential of state pension obligations making the muni market volatile. In addition, my tax bracket is lower now and the Federal tax-exempt benefits of muni bonds relatively to the state tax-exempt benefit of Treasury bonds is much smaller now. On a very high level, my bond portfolio is about 1/3rd muni bonds, 1/3rd treasury bonds, and 1/3rd inflation-linked treasury bonds (and savings bonds). These are all investment-grade and either short or intermediate term (average duration of 6 years or less).
No real changes on the stocks side. I know that US stocks have higher valuations, but that’s something that is already taken into account with my investment plan as I own businesses from around the world and US stocks are only about 30% of my total portfolio. I have been buying more shares of the Emerging Markets index fund as part of my rebalancing with new dividends and interest. I am considering tax-loss harvesting some older shares with unrealized losses against another Emerging Markets ETF.
The stock/bond split is currently at 68% stocks/32% bonds. Once a quarter, I reinvest any accumulated dividends and interest that were not spent. I don’t use automatic dividend reinvestment.
Performance commentary. According to Personal Capital, my portfolio now slightly down in 2018 (-2.7% YTD). I see that during the same period the S&P 500 has gained 5% (excludes dividends), Foreign (EAFA?) stocks are down 8.2%, and the US Aggregate bond index is down 2.4%. My portfolio is relatively heavy in international stocks which have done worse than US stocks so far this year.
An alternative benchmark for my portfolio is 50% Vanguard LifeStrategy Growth Fund (VASGX) and 50% Vanguard LifeStrategy Moderate Growth Fund (VSMGX), one is 60/40 and one is 80/20 so it also works out to 70% stocks and 30% bonds. That benchmark would have a total return of +0.07% YTD (as of 10/16/18).
I’ll share about more about the income aspect in a separate post.

 This is not a happy post, but it’s also the reality for a lot of people so I think it is a valid discussion. The Early Retirement forums had a thread recently titled
  Here’s a refreshingly blunt quote from Scott Galloway’s article
  I was surprised to read the NY Times article
 Like many others, I had a vague goal of $1 million net worth in my 20s. It’s easy to find a theoretical path a million. For example, $750 per month earning 8% returns for 30 years with get you there. Doing the actual earning, saving and investing is the hard part. It gets even harder during a bear market when your money feels like it is burning up in flames.


 Vanguard recently released How America Saves 2018 report [PDF], which looks at the nearly 5 million 401k, 403b, and other defined-contribution retirement plans that they service. If you are curious about how your 401k stats compare with others, there is a great deal of information in this report. Here are a few quick stats based on 2017 data:
 T. Rowe Price has a brochure The Benefit of Saving Regularly For Retirement [pdf] which has the common advice that you target saving at least 15% of your gross income each year to prepare for retirement. Of course, the earlier you start, the better. The added wrinkle here is that they offer an alternative route if you find 15% a stretch when you are young.
 Every time a large corporation stumbles, you will see something along these lines:
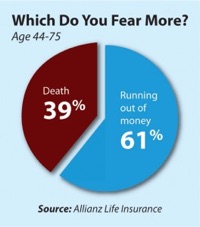
  You may have read recently that the Social Security Trust Fund is starting to shrink, and that it is projected to run out of money in 16 years. (Medicare’s trust fund is projected to run out in 8.) This is not the same thing as Social Security itself running out of money, as most Social Security payments to retirees come from the payroll taxes paid by current workers. As the

 If you have researched retirement at all (early or otherwise), you’ve probably ran across various retirement calculators online. You input how much money you have (or plan to have), your asset allocation, and it spits out some numbers. This


 The Best Credit Card Bonus Offers – 2025
 Big List of Free Stocks from Brokerage Apps
 Best Interest Rates on Cash - 2025
 Free Credit Scores x 3 + Free Credit Monitoring
 Best No Fee 0% APR Balance Transfer Offers
 Little-Known Cellular Data Plans That Can Save Big Money
 How To Haggle Your Cable or Direct TV Bill
 Big List of Free Consumer Data Reports (Credit, Rent, Work)