Know What You Own: Real Estate Investment Trusts (REIT) Infographic

Often you’ll hear investment advice like “just buy an index fund and forget about it”, but when a severe crisis occurs, it’s really hard to just forget about it. Substitute advice like “sell now and wait for the dust to settle” may start to sound equally wise. It’s harder to maintain faith in an investment if you don’t understand what you actually own.

As an example, I own real estate investment trusts, and Visual Capitalist just published a handy infographic on The World’s Largest Real Estate Investment Trusts. They are all headquartered in the United States, which makes them also the top 10 holdings of the Vanguard Real Estate ETF (VNQ).

In fact, these ten companies make up about 50% of VNQ. Here’s a quick peek at what specific types of real estate properties these companies own.

  • Prologis. This industrial REIT manages things like warehouses and distribution centers. Their largest customers are Amazon.com, Home Depot, and FedEx.
  • American Tower. This communications REIT owns communications infrastructure like cellular towers. Their largest customers are AT&T, T-Mobile, and Verizon.
  • Crown Castle. This communications REIT owns communications infrastructure like cellular towers. Their largest customers are AT&T, T-Mobile, and Verizon.
  • Public Storage. This self-storage REIT is the largest self-storage brand in the US.
  • Equinix. This data center REIT manages internet connection and data centers. Their customers include Amazon, Apple, AT&T, Meta/Facebook, and Nokia.
  • Simon Property Group. This mall REIT manages shopping malls, outlet centers, and community/lifestyle centers. The largest of their 200+ properties all around the country is King of Prussia in Philadelphia.
  • Welltower. This healthcare REIT owns senior housing (independent living, assisted living and memory care communities), post-acute care, and outpatient care centers.
  • Digital Realty. This data center REIT owns “carrier-neutral data centers and provides colocation and peering services” for hundreds of large companies.
  • Realty Income. This commercial REIT specializes in free-standing, single-tenant commercial properties that work on triple net lease agreements (the lessee handles property taxes, insurance, and maintenance on the properties). Largest tenants include Walgreens, Dollar General, 7-11, and Dollar Tree.
  • AvalonBay Communities. This residential REIT invests in apartment complexes.

REITs own a wide variety of real estate that touch our lives every day. You may live in or drive by an apartment complex, shop at a Walgreens, have your Amazon order shipped from, connect your phone to 4G/5G from, or be browsing a website that pays rent to one of these companies. When the next crisis inevitably occurs, you should remember that your investment in REITs owns a part of all these physical properties. Yes, their stock market price may drop for a while, but you are still owning critical infrastructure for the economy that isn’t going anywhere.

With a market-cap weighting, you will always own the most successful REITs. Would I have invested in data centers on my own? Cell towers? Public storage? The good news is that I don’t need to know.

Here is the historical chart for the Vanguard REIT ETF (VNQ). $10,000 invested at inception in 1996 would be worth $130,000 today with dividends reinvested. A traditional rental property would have also appreciated a lot over the last 25 years, but there are also several variables in the mix (leverage via mortgage, interest paid, repair/maintenance costs, time spent, taxes, deprecation, deferred capital gains, etc.) I am still fascinated by the idea, but for now owning real property via REITs suits my lifestyle and personality much better.

MMB Portfolio 2022 1st Quarter Update: Dividend & Interest Income

via GIPHY

Here’s a slightly-altered quarterly update on the income produced by my Humble Portfolio. I track the income produced as way to add a different view of performance. The total income goes up much more gradually and consistently than the number shown on brokerage statements (price), which helps encourage consistent investing. I imagine them as building up a factory that churns out dollar bills.

Annual income history. I started tracking the income from my portfolio in 2014. Here’s what the annual distributions from my portfolio look like over time:

  • $1,000,000 invested in my portfolio as of January 2014 would have generated about $24,000 in annual income over the previous 12 months. (2.4% starting yield)
  • If I reinvested the income but added no other contributions, today in 2022 it would have generated ~$46,000 in annual income over the previous 12 months.
  • If I spent every penny of the income every single year instead, today in 2022 it would still have generated ~$36,000 in annual income over the previous 12 months.

This chart shows how the annual income generated by my portfolio has changed.

TTM income yield. To estimate the income from my portfolio, I use the weighted “TTM” or “12-Month Yield” from Morningstar, which is the sum of the trailing 12 months of interest and dividend payments divided by the last month’s ending share price (NAV) plus any capital gains distributed (usually zero for index funds) over the same period. The trailing income yield for this quarter was 2.51%, as calculated below. Then I multiply by the current balance from my brokerage statements to get the total income.

Asset Class / Fund % of Portfolio Trailing 12-Month Yield Yield Contribution
US Total Stock (VTI) 25% 1.30% 0.33%
US Small Value (VBR) 5% 1.77% 0.09%
Int’l Total Stock (VXUS) 25% 3.21% 0.80%
Emerging Markets (VWO) 5% 2.96% 0.15%
US Real Estate (VNQ) 6% 2.78% 0.17%
Inter-Term US Treasury Bonds (VGIT) 17% 1.19% 0.20%
Inflation-Linked Treasury Bonds (VTIP) 17% 4.52% 0.77%
Totals 100% 2.51%


Stock market dividend growth over time. Stock dividends are a portion of profits that businesses have decided they don’t need to reinvest into their business. The dividends may suffer some short-term drops, but over the long run they have grown faster than inflation. The ratio of dividend payouts to price also serve as a rough valuation metric. When stock prices drop, this percentage metric usually goes up – which makes me feel better in a bear market. When stock prices go up, this percentage metric usually goes down, which keeps me from getting too euphoric during a bull market.

Here’s a related quote from Jack Bogle (source):

The true investor will do better if he forgets about the stock market and pays attention to his dividend returns and to the operating results of his companies.

If you retired back in 2014 and have been living off your stock/bond portfolio, your total income distributions are much higher in 2022 than in 2014. Here is the historical growth of the S&P 500 total dividend, which tracks roughly the largest 500 stocks in the US, updated as of Q1 2022 (via Yardeni Research):

This means that if you owned enough of the S&P 500 to produce an annual dividend income of about $26,000 a year in 1999, then today those same shares would be worth a lot more AND your annual dividend income would have increased to over $100,000 a year, even if you had spent every penny of dividend income every year!

Here is the historical growth of the total dividend of the EAFE iShares MSCI ETF, which tracks a broad index of developed non-US stocks (VXUS is a newer ETF), via Netcials.

European corporate culture seems to encourage paying out a higher percentage of earnings as dividends, but is also more forgiving of adjusting the dividends up and down with earnings. US corporate culture tends to be more conservative, with the expectation that dividends will be growing or at least stable. This is not true across every company, just a general observation.

Use as a retirement planning metric. It’s true that during the accumulation stage, your time is better spent focusing on earning potential via better career moves, improving in your skillset, and/or looking for entrepreneurial opportunities where you can have an ownership interest. As an overall numerical goal, I support the simple 4% or 3% rule of thumb, which equates to a target of accumulating roughly 25 to 30 times your annual expenses. I would lean towards a 3% withdrawal rate if you want to retire young (before age 50) and a 4% withdrawal rate if retiring at a more traditional age (closer to 65).

However, I find that tracking income makes more tangible sense in my mind and is more useful for those who aren’t looking for a traditional retirement. Our dividends and interest income are not automatically reinvested. They are another “paycheck”. Then, as with a traditional paycheck, we can choose to either spend it or invest it again to compound things more quickly. Even if we spend the dividends, this portfolio paycheck will still grow over time. You could use this money to cut back working hours, pursue a different career path, start a new business, take a sabbatical, perform charity or volunteer work, and so on. This is your one life and it only lasts about 4,000 weeks.

MMB Humble Portfolio 2022 1st Quarter Update: Asset Allocation & Performance

portpie_blank200Here’s my quarterly update on my current investment holdings as of 4/8/22, including our 401k/403b/IRAs and taxable brokerage accounts but excluding a side portfolio of self-directed investments. Following the concept of skin in the game, the following is not a recommendation, but just to share an real, imperfect, low-cost, diversified DIY portfolio. The goal of this “Humble Portfolio” is to create sustainable income that keeps up with inflation to cover our household expenses.

TL;DR changes: Both stocks and bonds went down a small bit. Slightly overweight REITs, slightly underweight International Stocks. As usual, collected dividends and interest and reinvested available leftover cash.

Actual Asset Allocation and Holdings
I use both Personal Capital and a custom Google Spreadsheet to track my investment holdings. The Personal Capital financial tracking app (free, my review) automatically logs into my different accounts, adds up my various balances, tracks my performance, and calculates my overall asset allocation. Once a quarter, I also update my manual Google Spreadsheet (free, instructions) because it helps me calculate how much I need in each asset class to rebalance back towards my target asset allocation. I also create a new tab each quarter, so I have snapshot of my holdings dating back many years.

Here are updated performance and asset allocation charts, per the “Allocation” and “Holdings” tabs of my Personal Capital account.

Stock Holdings (same as last quarter)
Vanguard Total Stock Market (VTI, VTSAX)
Vanguard Total International Stock Market (VXUS, VTIAX)
Vanguard Small Value (VBR)
Vanguard Emerging Markets (VWO)
Avantis International Small Cap Value ETF (AVDV)
Cambria Emerging Shareholder Yield ETF (EYLD)
Vanguard REIT Index (VNQ, VGSLX)

Bond Holdings
Vanguard Limited-Term Tax-Exempt (VMLTX, VMLUX)
Vanguard Intermediate-Term Tax-Exempt (VWITX, VWIUX)
Vanguard Intermediate-Term Treasury (VFITX, VFIUX)
Vanguard Inflation-Protected Securities (VIPSX, VAIPX)
Fidelity Inflation-Protected Bond Index (FIPDX)
iShares Barclays TIPS Bond (TIP)
Individual TIPS bonds
U.S. Savings Bonds (Series I)

Target Asset Allocation. This “Humble Portfolio” does not rely on my ability to pick specific stocks, sectors, trends, or countries. I own broad, low-cost exposure to asset classes that will provide long-term returns above inflation, distribute income via dividends and interest, and finally offer some historical tendencies to balance each other out. I have faith in the long-term benefit of owning publicly-traded US and international shares of businesses, as well as high-quality US Treasury and municipal debt. My stock holdings roughly follow the total world market cap breakdown at roughly 60% US and 40% ex-US. Some minor wrinkles are the inclusion of “small value” ETFs for US, Developed International, and Emerging Markets stocks as well as additional real estate exposure through US REITs.

I strongly believe in the importance of knowing WHY you own something. Every asset class will eventually have a low period, and you must have strong faith during these periods to truly make your money. You have to keep owning and buying more stocks through the stock market crashes. You have to maintain and even buy more rental properties during a housing crunch, etc. A good sign is that if prices drop, you’ll want to buy more of that asset instead of less. I don’t have strong faith in the long-term results of commodities, gold, or bitcoin – so I don’t own them. Simple as that.

I do not spend a lot of time backtesting various model portfolios, as I don’t think picking through the details of the recent past will necessarily create superior future returns. Usually, whatever model portfolio is popular in the moment just happens to hold the asset class that has been the hottest recently as well.

Find productive assets that you believe in and understand, and just keep buying them through the ups and downs. Mine may be different than yours.

Stocks Breakdown

  • 45% US Total Market
  • 7% US Small-Cap Value
  • 31% International Total Market
  • 7% International Small-Cap Value
  • 10% US Real Estate (REIT)

Bonds Breakdown

  • 66% High-Quality bonds, Municipal, US Treasury or FDIC-insured deposits
  • 34% US Treasury Inflation-Protected Bonds (or I Savings Bonds)

I have settled into a long-term target ratio of 67% stocks and 33% bonds (2:1 ratio) within our investment strategy of buy, hold, and occasionally rebalance. This is more conservative than most people my age, but I am settling into a more “perpetual income portfolio” as opposed to the more common “build up a big stash and hope it lasts until I die” portfolio. My target withdrawal rate is 3% or less. With a self-managed, simple portfolio of low-cost funds, we can minimize management fees, commissions, and taxes.

Holdings commentary. I know I sound like a broken record, but really, my best investment decisions have been convincing myself to do nothing during times of stress. Sometimes it was easy, sometimes it was hard. Still, after investing steadily for over 15 years, my results have exceeded my expectations and the fluctuations are now often greater than my annual spending. To make it easier, I try to ignore daily talk about stock movements.

There is ALWAYS something that looks worrying. I am a “buy, hold, and cash the checks” kind of investor. I often wonder how I can teach my children such patience in investing, and that seems to be the hardest aspect.

Performance numbers. According to Personal Capital, my portfolio down about 6% for 2022 YTD. US stocks, International stocks, and even US bonds are all down roughly 6-8%. REITs are the only things that went up. As such, in terms of rebalancing, the portfolio is slightly overweight in REITs and slightly underweight in International Stocks, so that is where the excess cash will be invested this quarter.

I’ll share about more about the income aspect in a separate post.

Backdoor Roth IRA Contribution 2022: Tips and Vanguard Example Screenshots

The official IRA contribution deadline for Tax Year 2021 is April 15th, 2022. However, I choose to use April 15th as the informal deadline for my same-year IRA contributions (Tax Year 2022). By around April 1st, I have usually finished filing my income taxes and thus have handled any expected tax bills. I also have the first quarter of dividends arrive in my brokerage accounts, so I also have funds ready to re-invest. The optimal time would actually be make my contributions on January 1st, but sometimes we just have to settle for “good enough”.

If your Modified Adjusted Gross Income (MAGI) exceeds the limits for a direct Roth IRA contribution ($144,000 for singles and $214,000 for married filing joint for tax year 2022), you may still be eligible for the “Backdoor” Roth IRA. Christine Benz of Morningstar has a excellent summary of Backdoor Roth IRA concerns.

A backdoor Roth is simple enough and should be tax-free in many cases. An investor who earns too much to make a direct Roth IRA contribution simply opens a traditional nondeductible IRA–available to investors regardless of income level. Shortly thereafter–and here’s where the backdoor part comes in–he converts it to a Roth IRA, another move unrestricted by income limits. Assuming he has no other IRA assets, the only taxes due on the conversion would be any appreciation in the investments since he opened the account. That taxable amount should be limited, assuming he converts the money promptly and/or leaves the money in cash until the conversion is finalized.

Here’s my even-shorter version of the tips:

  • First, check if you have other pre-tax traditional IRA assets such as a rollover IRA. Converting to a Roth IRA may subject these assets to taxes on a pro-rated basis.
  • Get rid of these pre-tax IRAs, if possible, by rolling them into an employer 401(k), 403(b), or 457 plan instead. Self-employed business owners can also roll into a Solo 401k.
  • Contribute and then convert to Roth quickly. Make the non-deductible Traditional IRA contribution, invest for a day or two in cash, and then quickly convert to Roth. The IRS has clarified that no waiting period is required, making it better to do it right away to avoid any tax complications.
  • Repeat at the beginning of every year. Just keep doing it every year, as soon as you can, and build up that precious Roth IRA balance that can grow tax-free forever with no required minimum distributions. Ignore news about the option “maybe” going away until it actually goes away.

Here’s our simple three-day process at Vanguard.

Day one: Make non-deductible contribution to a Traditional IRA account. You could fund in various ways, I exchanged from funds within my Vanguard taxable brokerage account. Just put it in Vanguard Federal Money Market temporarily.

Day two: Go to “Balances & Holdings” page and find the “Convert to Roth IRA” link. Complete required steps.

Day three: Your traditional IRA balance is now $0. Invest the funds that are now in your Roth IRA. In this case, I would have a taxable gain of just $0.03, which simply rounds to zero.

Note: There is still some debate about how much time should pass between the non-deductible Traditional IRA contribution and the Roth conversion. Some people believe that the 2017 Tax Cuts and Jobs Act (TCJA) officially signaled acceptance of this move. Others still want you to wait either for a monthly statement or even a full year in between the steps. I’m not a tax attorney and this is not tax advice. This is just what I did and I don’t lose any sleep over it.

Optimal Target Date Fund Glide Path, Per Deep Learning AI

The WSJ article Why Target-Date Funds Might Be Inappropriate for Most Investors (free gift article) discusses new research using “deep learning” artificial intelligence to find the optimal asset allocation over time. There are several interesting insights that also agree with common sense. For example, one size doesn’t fit all. Wealthier investors can withstand the volatility from holding a much higher stock allocation, whereas lower net worth investors need to be more conservative to avoid a hitting zero due to a bad sequence of returns.

Here is how the optimal glide path for the average investor differs between Deep Learning analysis vs. actual Target Date Funds:

Though the primary insight of this modeling is that one size doesn’t fit all, the research did reach one conclusion that does apply to all of us on average: The typical glide path used by target-date funds is too conservative starting at the age of 50. In contrast to an equity exposure level that drops to 50% by retirement age and to as low as 30% during retirement, the average recommended equity exposure in the researchers’ model never falls below 60%.

While I don’t know the details regarding the underlying assumptions of this research, the red AI line caught my eye because I also don’t plan on going below about 60% stocks ever in my lifetime. My reasoning is that I am going for a “perpetual withdrawal rate” scenario where my I just live off a base of growing dividends and interest. (I’m not talking about owning only extreme high-yield products like closed-end ETFs, junk bonds, and leveraged REITs). After reaching the “safe withdrawal rate” number that is based on a very high likelihood of not dying with zero, I wanted even more margin of safety. It can be counterintuitive, but over the long run owning businesses can be “safer” than just own a big bag of cash that is constantly exposed to inflation risk.

Schwab Lifetime Adjustable Income: Flexible Withdrawal Rules Based On Portfolio Survival Chances

One of the perpetual debates in retirement planning circles is withdrawal rates, AKA how much monthly income can you take from a portfolio. Once you nail down a withdrawal rate and retirement spending target, then you get Your Number – how much you need to have saved to retire (after backing out Social Security and other income streams). It’s common to start with the static 4% rule, but that rule also includes some drawbacks. An alternative is a flexible withdrawal rule that adjusts based on market returns. When your portfolio grows, you can spend a little more. If it shrinks, you cut back a little. Sounds reasonable, right?

However, I haven’t seen many real-world examples of flexible withdrawal rules. Schwab has helpfully outlined one proposed method in this memo: Lifetime Adjustable Income vs. the 4% Rule: Can You Spend More in Retirement with Less Risk? This provides the underlying basis behind their robo-advisor feature called Intelligent Income where you can pick a comfort level and the software will tell you how much you can withdraw each year and from which type of account (IRA, Roth IRA, taxable, etc).

In this memo, we compare a flexible withdrawal strategy to the static 4% rule. We recommend a lifetime adjustable income strategy, described in this paper, that can be put into action using an annually updated financial plan, using technology or an advisor. Doing so may help increase spending early in, and over a long, retirement and help ensure your money lasts.

Here’s their example structure for flexible withdrawals:

  • Set an initial withdrawal rate that delivers an 80% probability of success (savings lasting).
  • Adjust spending amounts after each year based on if the probability of savings lasting falls outside the range you decide: here it is below 75% or above 99%. If these thresholds are crossed, increase or decrease spending by the amount that brings the financial plan back to a 99% probability of savings lasting. This results in fewer but more drastic cuts.
  • Add “guardrails”. A minimum and maximum acceptable annual (real) spending amount of $25,000 and $60,000, respectively, meaning that we will always withdraw at least $25,000 (or at most $60,000).

Using these flexible rules, the initial withdrawal rate was about $43,000 instead of $40,000. Across all of the simulated scenarios, the average annual withdrawal was basically 20%, or $10,000 a year, higher: $50,000 a year instead of the $40,000 a year (in today’s dollars). Even better, the likelihood of running out of money dropped.

However, you must look past the averages and see that you are now exposed to the extremes. Look at that wide expanse of grey. A significant number of the scenarios involved some extended deep cuts to spending, hitting and hovering just above the $25,000 minimum guardrail. You’ll have to decided if you like this trade-off between probably getting more income but possibly enduring some big cuts. This is why many financially-conservative people would prefer to simply start out at a lower 3% or 3.5% withdrawal rate and adjust upwards if the portfolio keeps growing.

In any case, I found it interesting that Schwab used the probability of portfolio survival rate as the factor used to adjust withdrawal rate. DIY investors can implement a similar system themselves. Here are some tools to estimate portfolio survival probability:

Big List of Social Security Tools: Best Time to Start Claiming Social Security Benefits?

Social Security is the largest source of retirement income for a majority of Americans. For about 1/3rd of them, Social Security makes up 90% or more of their retirement income.

ss_percent

Depending on your assumptions, the “lump sum value” of your Social Security benefits is somewhere between $300,000 and $700,000. (Source: Kitces)

Even this large figure ignores the fact that your Social Security income is guaranteed to rise each year with inflation, something no other private annuity company in the world even offers any longer at any price!

Therefore, spending a little time and money in order to consider the many options for Social Security (especially for those married, divorced, widowed, or disabled) can really make a difference. This NYT article (free, gift article) lists a number of services that help you navigate the rules (at a variety of service levels and price points). In no particular order:

I don’t have any in-depth experience with any of these online tools, but when the time comes I’d probably pony up the money (adds up to less than $100 for all three) and compare the results. If they are properly programmed, they should all agree, right?

The tools below go beyond Social Security claiming strategies and more into overall retirement income planning.

Even if you’re still far away from claiming time, be sure to sign up for your official mySocialSecurity account (before a scammer does) and take a peek at your stats each year. For those that like tinkering, try copy and pasting your anonymous data into the SSA.tools website (free) and play around with different future scenarios.

In the end, you may not follow the software recommendations exactly, but simply knowing about the different options and factors can be helpful. In my experience, many people just end up claiming earlier because they want “their” money sooner rather than later without understanding the potential drawbacks. A retiree may want to have their “own” paycheck again if their partner still works.

Will Your Robo-Advisor Stay The Course? UBS Buys Wealthfront

Over time, more and more people are seeing the benefits of investing in stocks and bonds through low-cost index funds. Here is a chart from Morningstar showing the overall flow of assets out of actively-managed and into passively-managed US equity funds over the last 15 years.

For a while, people wondered if low-cost digital advisors that managed a portfolio of index funds for a modest fee would take over. The picture looks a little different today.

Wealthfront was one of the early digital-only startups, promising to manage a diversified portfolio of low-cost ETFs for you for a modest 0.25% of assets, even if you had as little as $500 to invest. They tried a few different things over the years, including changing up their model portfolios, trying to add a in-house risk-parity fund, and even recently adding crypto and individual stock options. Their final move came this week, when they announced they would be sold to UBS for $1.4 billion. This wasn’t exactly a huge exit, given the huge amount of venture capital they had burned through over the years. As usual with such acquisitions, they promise both “nothing will change” and “things will only get better”.

In hindsight, I am relieved that I didn’t let Wealthfront handle my assets. They clearly had no firm guiding principles, tweaking their portfolios with each new trend. Based on the reporting, it looks like they sold their customers to the highest bidder, as UBS is not exactly known for low-cost passive investing. This play is widely seen a way for UBS to obtain young investors that will one day be rich (read: one day will generate lots of wealth management fees). See UBS Buys Wealthfront for $1.4 Billion to Reach Rich Young Americans and Why a Bank for the Super Rich Is Taking Aim at the Younger Merely Rich.

Is this move what is best for Wealthfront’s customers? Or what was best for Wealthfront’s investors? Mark the date. I will be checking to see what Wealthfront clients own in 5 and 10 years, if that is still possible. Keep in mind that any portfolio changes usually result in taxable events.

Funds flowed into index funds for a simple reason: they performed better and made folks more money. Index funds performed better primarily due to low costs and low turnover (low tax costs). However, it doesn’t appear that Wealthfront could operate successfully independently while offering low costs. One way or another, the new owners are going to try and extract more money per client either via portfolio changes or higher fee products.

Unfortunately, I worry that even Vanguard, in its pursuit of growth, is gradually going down the same path as many large nonprofits. Many “nonprofits” are huge bureaucracies that chase money as eagerly as any corporation – more money means bigger salaries to management, more political power, and greater career advancement. (Side note: I thought that Vanguard got away with their huge Target Date fund capital gains distribution with little media attention, but now see: Massachusetts investigating sales of target date funds to retail investors after word of surprise tax bills.)

I don’t write much about robo-advisors any more. They showed promise initially, but apparently the business model just isn’t working.

MMB Portfolio 2021 Year-End (Late Update): Dividend and Interest Income

dividendmono225
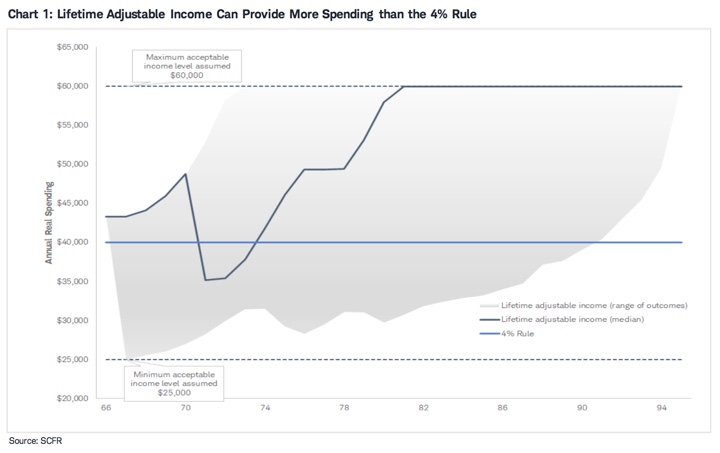
Here’s my (late) quarterly update on the income produced by my “Humble Portfolio“. The total income goes up much more gradually and consistently than the number shown on brokerage statements (price), encouraging me as I keep plowing more of my savings into more stock purchases. I imagine them as a factory that just churns out more dollar bills.

via GIPHY

Income yield history (percentage of portfolio value). Here is a chart showing how this 12-month trailing income rate has varied since I started tracking it in 2014. There appears to be a slight recovery from the early pandemic time period.

I track the “TTM” or “12-Month Yield” from Morningstar, which is the sum of the trailing 12 months of interest and dividend payments divided by the last month’s ending share price (NAV) plus any capital gains distributed over the same period. (ETFs rarely have to distribute capital gains.) I prefer this measure because it is based on historical distributions and not a forecast. Below is a rough approximation of my portfolio (2/3rd stocks and 1/3rd bonds).

Asset Class / Fund % of Portfolio Trailing 12-Month Yield (Taken 1/24/22) Yield Contribution
US Total Stock
Vanguard Total Stock Market Fund (VTI, VTSAX)
25% 1.21% 0.30%
US Small Value
Vanguard Small-Cap Value ETF (VBR)
5% 1.75% 0.09%
International Total Stock
Vanguard Total International Stock Market Fund (VXUS, VTIAX)
25% 3.09% 0.77%
Emerging Markets
Vanguard Emerging Markets ETF (VWO)
5% 2.64% 0.13%
US Real Estate
Vanguard REIT Index Fund (VNQ, VGSLX)
6% 2.56% 0.15%
Intermediate-Term High Quality Bonds
Vanguard Intermediate-Term Treasury ETF (VGIT)
17% 1.14% 0.19%
Inflation-Linked Treasury Bonds
Vanguard Short-Term Inflation-Protected Securities ETF (VTIP)
17% 4.69% 0.80%
Totals 100% 2.44%


Stock dividends are the portion of profits that businesses have decided they don’t need to reinvest into their business. The dividends may suffer some short-term drops, but over the long run they have grown faster than inflation.

The ratio of dividend payouts to price also serve as a rough valuation metric. When stock prices drop, this percentage metric usually goes up – which makes me feel better in a bear market. When stock prices go up, this percentage metric usually goes down, which keeps me from getting too euphoric during a bull market.

Here’s a related quote from Jack Bogle (source):

The true investor will do better if he forgets about the stock market and pays attention to his dividend returns and to the operating results of his companies.

Absolute dividend history. Even though the dividend yield hasn’t been too impressive, there is a different story when you look at the absolute amount of income paid out over time. If you retired back in 2014 and have been living off your stock/bond portfolio, your total income distributions are much higher in 2022 than in 2014.

Here is the historical growth of the S&P 500 absolute dividend, which tracks roughly the largest 500 stocks in the US, updated as of Q4 2021 (via Yardeni Research):

This means that if you owned enough of the S&P 500 to produce an annual dividend income of about $13,000 a year in 1999, then today those same shares would be worth a lot more AND your annual dividend income would have increased to over $50,000 a year, even if you had spent every penny of dividend income every year.

Here is the historical growth of the absolute dividend of the EAFE iShares MSCI ETF, which tracks a broad index of developed non-US stocks (VXUS is a newer ETF), via Netcials.

European dividend culture seems to encourage paying out a higher percentage of earnings as dividends, but as a result those dividends are also more volatile, moving up and down with earnings. US dividend culture tends to be more conservative, with the expectation that dividends will be growing or at least stable. This is not true across every company, but in general there appears to be a greater stigma associated with dividend cuts in US stocks than in international stocks.

Big picture and rules of thumb. If you are not close to retirement, there is not much use worrying about decimal points. Your time is better spent focusing on earning potential via better career moves, improving in your skillset, and/or looking for entrepreneurial opportunities where you can have an ownership interest.

As a result, I support the simple 4% or 3% rule of thumb, which equates to a target of accumulating roughly 25 to 30 times your annual expenses. I would lean towards a 3% withdrawal rate if you want to retire young (before age 50) and a 4% withdrawal rate if retiring at a more traditional age (closer to 65). Build in some spending flexibility to make your portfolio more resilient in the real world, and that’s a reasonable goal to put on your wall.

Using the income before “full” retirement. Our dividends and interest income are not automatically reinvested. I treat this money as part of our “paycheck”. Then, as with a traditional paycheck, we can choose to either spend it or invest it again to compound things more quickly. Even if still working, you could use this money to cut back working hours, pursue a different career path, start a new business, take a sabbatical, perform charity or volunteer work, and so on. This is your one life and it only lasts about 4,000 weeks.

MMB Portfolio 2021 Year-End (Late Update): Asset Allocation & Performance

portpie_blank200Here’s my (late) quarterly update on my current investment holdings, as of 1/23/22, including our 401k/403b/IRAs and taxable brokerage accounts but excluding a side portfolio of self-directed investments. Following the concept of skin in the game, the following is not a recommendation, but just to share an real, imperfect, low-cost, diversified DIY portfolio. The goal of this portfolio is to create sustainable income that keeps up with inflation to cover our household expenses.

Actual Asset Allocation and Holdings
I use both Personal Capital and a custom Google Spreadsheet to track my investment holdings. The Personal Capital financial tracking app (free, my review) automatically logs into my different accounts, adds up my various balances, tracks my performance, and calculates my overall asset allocation. Once a quarter, I also update my manual Google Spreadsheet (free, instructions) because it helps me calculate how much I need in each asset class to rebalance back towards my target asset allocation.

Here are updated performance and asset allocation charts, per the “Allocation” and “Holdings” tabs of my Personal Capital account.

Stock Holdings
Vanguard Total Stock Market (VTI, VTSAX)
Vanguard Total International Stock Market (VXUS, VTIAX)
Vanguard Small Value (VBR)
Vanguard Emerging Markets (VWO)
Avantis International Small Cap Value ETF (AVDV)
Cambria Emerging Shareholder Yield ETF (EYLD)
Vanguard REIT Index (VNQ, VGSLX)

Bond Holdings
Vanguard Limited-Term Tax-Exempt (VMLTX, VMLUX)
Vanguard Intermediate-Term Tax-Exempt (VWITX, VWIUX)
Vanguard Intermediate-Term Treasury (VFITX, VFIUX)
Vanguard Inflation-Protected Securities (VIPSX, VAIPX)
Fidelity Inflation-Protected Bond Index (FIPDX)
iShares Barclays TIPS Bond (TIP)
Individual TIPS bonds
U.S. Savings Bonds (Series I)

Target Asset Allocation. This “Humble Portfolio” does not rely on my ability to pick specific stocks, sectors, trends, or countries. I own broad, low-cost exposure to asset classes that will provide long-term returns above inflation, distribute income via dividends and interest, and finally offer some historical tendencies to balance each other out. I have faith in the long-term benefit of owning publicly-traded US and international shares of businesses, as well as high-quality US federal and municipal debt. My stock holdings roughly follow the total world market cap breakdown at roughly 60% US and 40% ex-US. I also own real estate through REITs.

I strongly believe in the importance of “knowing WHY you own something”. Every asset class will eventually have a low period, and you must have strong faith during these periods to truly make your money. You have to keep owning and buying more stocks through the stock market crashes. You have to maintain and even buy more rental properties during a housing crunch, etc. You might own laundromats or vending machines or an online business. A good sign is that if prices drop, you’ll want to buy more of that asset instead of less.

Find a good asset that you believe in and understand, and just keep buying it through the ups and downs.

I do not spend a lot of time backtesting various model portfolios, as I don’t think picking through the details of the recent past will necessarily create superior future returns. Usually, whatever model portfolio is popular in the moment just happens to hold the asset class that has been the hottest recently as well. I’ve also realized that I don’t have strong faith in the long-term results of commodities, gold, or bitcoin. I’ve tried many times to wrap my head around it, but have failed. I prefer things that send me checks while I sleep.

Stocks Breakdown

  • 45% US Total Market
  • 7% US Small-Cap Value
  • 31% International Total Market
  • 7% International Small-Cap Value
  • 10% US Real Estate (REIT)

Bonds Breakdown

  • 66% High-Quality bonds, Municipal, US Treasury or FDIC-insured deposits
  • 33% US Treasury Inflation-Protected Bonds (or I Savings Bonds)

I have settled into a long-term target ratio of 67% stocks and 33% bonds (2:1 ratio) within our investment strategy of buy, hold, and occasionally rebalance. This is more conservative than most people my age, but I am settling into a more “perpetual” as opposed to the more common “build up a big stash and hope it lasts until I die” portfolio. My target withdrawal rate is 3% or less. With a self-managed, simple portfolio of low-cost funds, we can minimize management fees, commissions, and taxes.

Holdings commentary. I’ve been investing steadily for over 15 years, and the results have exceeded my expectations. There is ALWAYS something that looks worrying. Looking back, my best investment decisions were to NOT do anything different during times of stress. Maybe 2022 will have more such times. Ignore the noise, if you can.

I often wonder how I can teach my children such patience in investing, and that seems to be the hardest aspect.

Performance numbers. According to Personal Capital, my portfolio is up another +13.9% for 2021.

I’ll share about more about the income aspect in a separate post.

Real-World Numbers: Investing $850 a Month Turned Into $200,000 Over 10 Years (2022 Edition)

Instead of focusing on the current hot thing, how about stepping back and taking the longer view? How would a steady investor have done over the last decade? Most successful savers invest money each year over a long period of time.

Target date funds. The Vanguard Target Retirement 2045 Fund is an all-in-one fund that is low-cost, globally-diversified, and available both inside many employer retirement plans and to anyone that funds an IRA. When you are young (up until age 40 for those retiring at 65), this fund holds 90% stocks and 10% bonds. It is a solid default choice in a world of mediocre, overpriced options. This is also a good benchmark for others that use low-cost index funds.

The power of consistent, tax-advantaged investing. For the last decade, the maximum allowable annual contribution to a Traditional or Roth IRA has been roughly $5,000 per person. The maximum allowable annual contribution for a 401k, 403b, or TSP plan has been over $10,000 per person. If you have a household income of $67,000, then $10,000 is right at the 15% savings rate mark. Therefore, I’m going to use $10,000 as a benchmark amount. This round number also makes it easy to multiply the results as needed to match your own situation. Save $5,000 a year? Halve the result. Save $20,000 a year? Double the numbers, and so on.

The real-world payoff from a decade of saving $833 a month. What would have happened if you put $10,000 a year into the Vanguard Target Retirement 2045 Fund, every year, for the past 10 years? With the interactive tools at Morningstar and a Google spreadsheet, we get this:

Investing $10,000 every year ($833 a month, or $384 per bi-weekly paycheck) for the last decade would have resulted in a total balance of $196,000. Bump that up to $850 a month, and you’d be sitting on $200,000 right now, broken up into $102,000 in contribution and $98,000 in investment gains.

What would have happened if you extended that to the past 15 years instead? Investing $10,000 every year for the last decade and a half would have resulted in a total balance of $353,000. That breaks down to $150k in contributions + $203k investment growth. Your gains are now officially more than what you initially invested.

Real-world path to becoming a 401(k) millionaire. Not theoretical numbers from a calculator! Are you a dual-income household that can put away more? If you each invested $14,150 a year ($28,300 total for both) for the last 15 years, you would have a million dollars. That means starting at age 22 and ending at 37, or starting at 25 and ending at 40.

It gets even better if you started early. There is a popular example of the power of compound interest that shows how someone who started saving at age 25, saves and invests for 10 years but then stops and never saves a penny again still beats someone who starts saving at 35 and keeps on saving for 30 years. Acorns provides a nice illustration:

Once you have that initial momentum, it just keeps going.

Timing still matters, but not as much as you might think due to the dollar-cost averaging and longer time horizon. Yes, the last decade has been a great run for US stock markets. But Vanguard Target funds also own a lot of international stocks, which haven’t been nearly as hot and have maintained lower valuations. Diversification means you aren’t 100% in the hot thing, but your bases are covered if the hot things goes cold. Here are my previous “saving for a decade” posts:

Work on improving your career skills (or start your own business), save a big chunk of your income, and then invest it in productive assets. Keep calm and repeat. The only “secret” here is consistency and starting as early as you can. (The best time is always yesterday. The second best time is today.) We have maxed out both IRA and the 401k salary deferral limits nearly every year since 2004. We are fortunate in many ways, but we received no inheritance and no house downpayment assistance. We are not super-skilled stock pickers or Bitcoin early adopters. You can still build serious wealth with something as accessible and boring as the Vanguard Target Retirement fund (or a simple collection of low-cost index funds).

2022 401k and IRA Contribution Limits

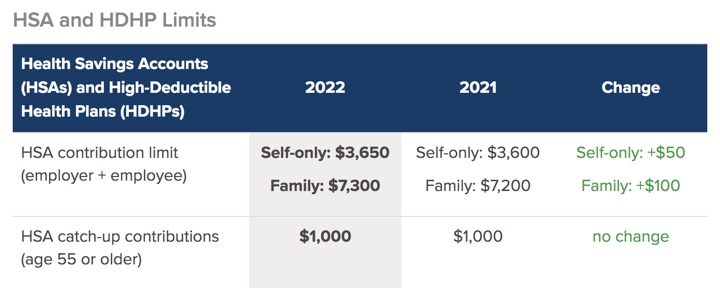
The beginning of the year is a good time to check on the new annual contribution limits to the various available retirement accounts. Our income has been quite variable these last few years, so I regularly adjust the paycheck deferral percentages based on expected income for the year. This
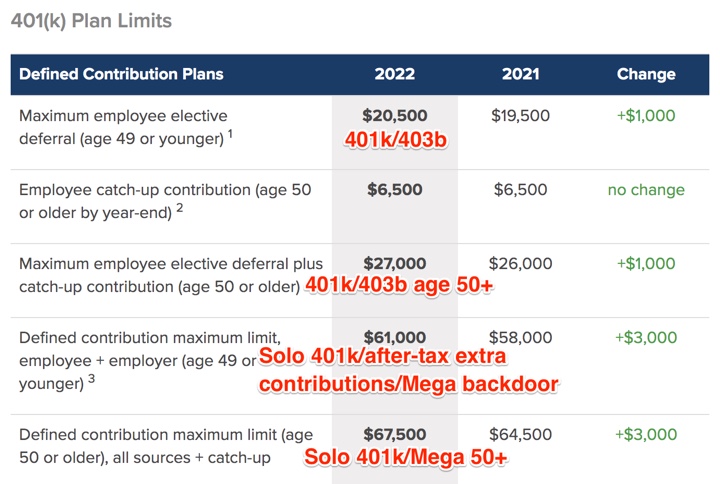
 SHRM article has a nice summary of 2022 vs. 2021 numbers for most employer-based accounts.

401k/403b Employer-Sponsored Accounts.

For example, I would break down the applicable limit down to monthly and bi-weekly amounts:

  • $20,500 annual limit = $1,708 per monthly paycheck.
  • $20,500 annual limit = $788 per bi-weekly paycheck.

If you are contributing to a pre-tax account instead of a Roth, you could also use a paycheck calculator to find the detailed impact to your take-home pay.

The higher numbers are for those folks that have the ability to contribute extra money into their 401k accounts on an after-tax basis (and potentially perform an in-service Roth rollover), or those self-employed persons with SEP IRAs or Self-Employed 401k plans.

The investment options in 401k plans have also improved on average steadily over the years with lower fees and costs, allowing your money to compound even faster.

Traditional/Roth IRAs. The annual contribution limits is unchanged from last year, $6,000 with an additional $1,000 allowed for those age 50+.

  • $6,000 annual limit = $500 per monthly paycheck.
  • $6,000 annual limit = $231 per bi-weekly paycheck.

Most brokerage accounts (Vanguard, Fidelity, M1 Finance) will allow you to set up automatic investments on a weekly, biweekly, or monthly basis. As long as you have enough money in your linked checking account, the broker will transfer the cash over and then invest it on a recurring basis. You may even be able to sync it to take out money the very same or next day as when your paycheck hits.

Health Savings Accounts are often treated as the equivalent of a “Healthcare IRA” due the potential triple tax benefits (tax-deduction on contributions, tax-deferred growth for decades, and tax-free withdrawals towards qualified healthcare expenses). This assumes that you have a high-deductible health insurance plan, you can cover your current healthcare expenses out-of-pocket, you can still afford to contribute to the HSA.

Even though I’ve been parroting the “standard personal finance advice” to raise that contribution percentage and save as much as you can in your 401k for years and years, it still holds true. There is some true mind trickery when the money never touches your bank account. The easiest way for me not to eat potato chips is not the have them in the house. (My nemesis is that Costco mega-sized bag of Himalayan Salt Kettle Chips…) The easiest way to make sure you don’t spend the money that you want to invest, is to never have it touch your bank account.